archivedcreated 2025-01-30· last activity 2026-08-15
Zone visualization strategies
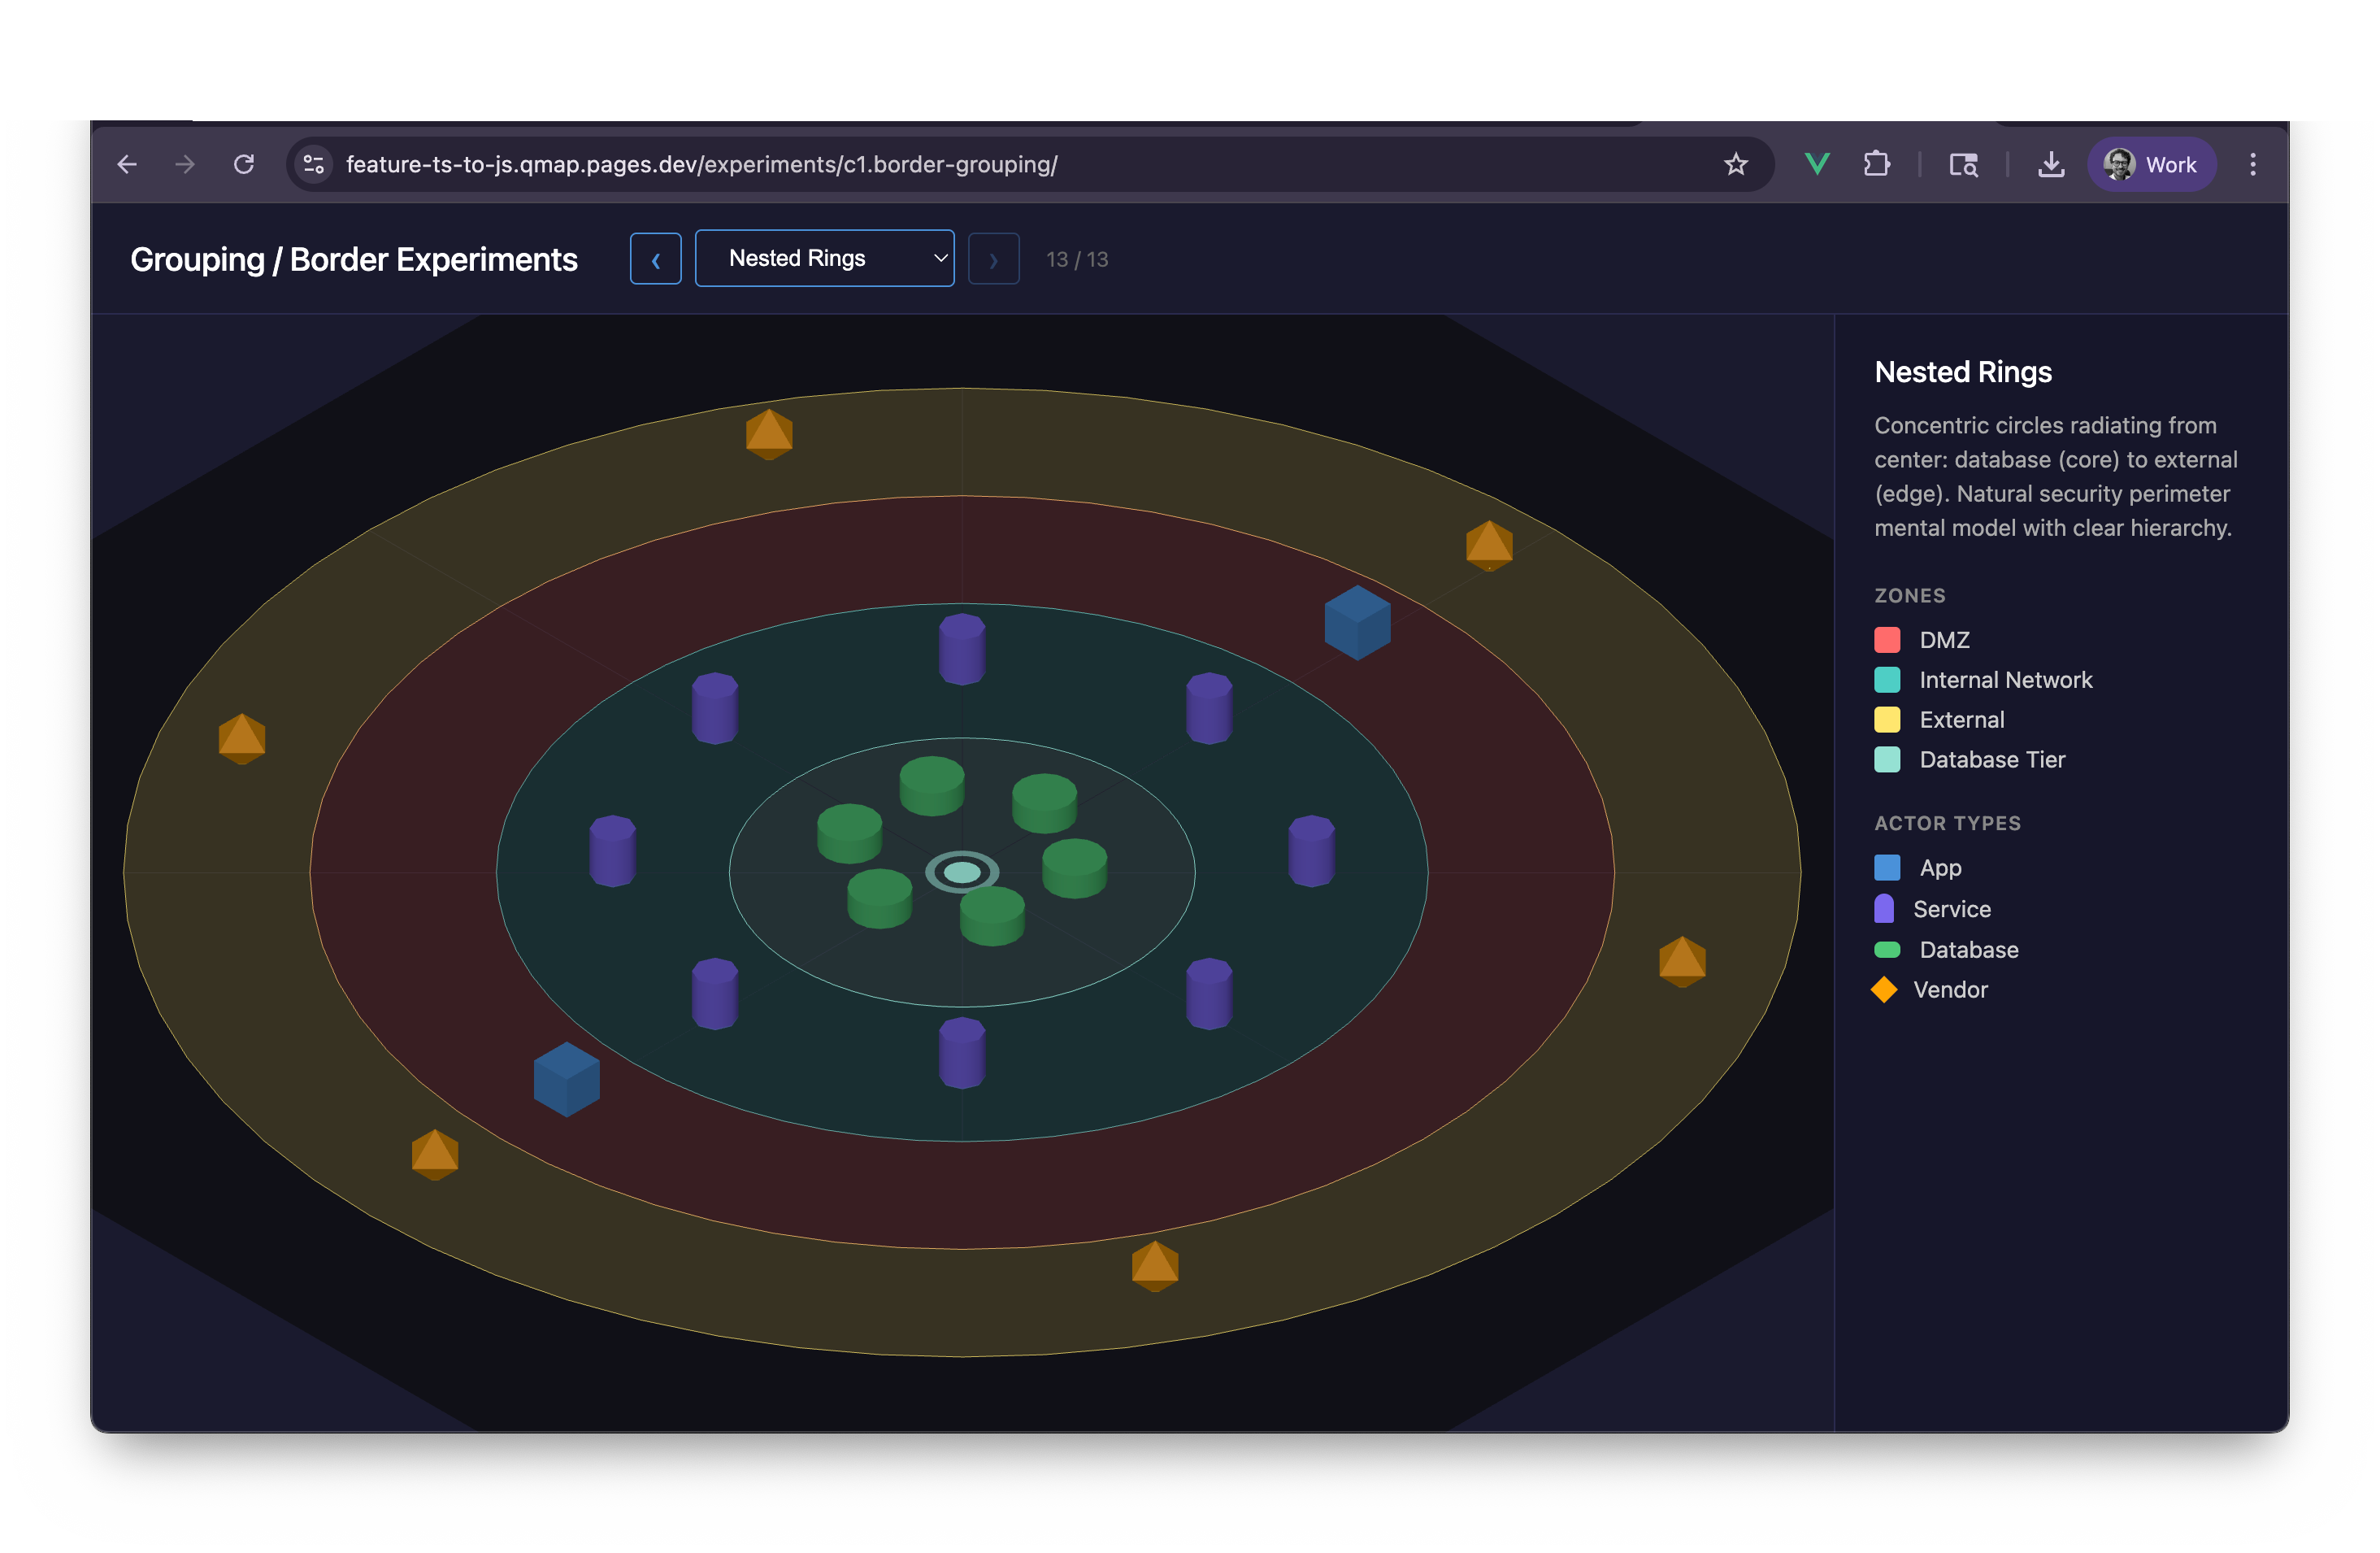
New in this cycle: Thirteen competing strategies for drawing zone boundaries in 3D
Why
Initial exploration of how to visually represent security zones, geographic boundaries, and organizational borders in the 3D scene. The core question: how do we show "where" an actor lives without cluttering the visualization?
Objective
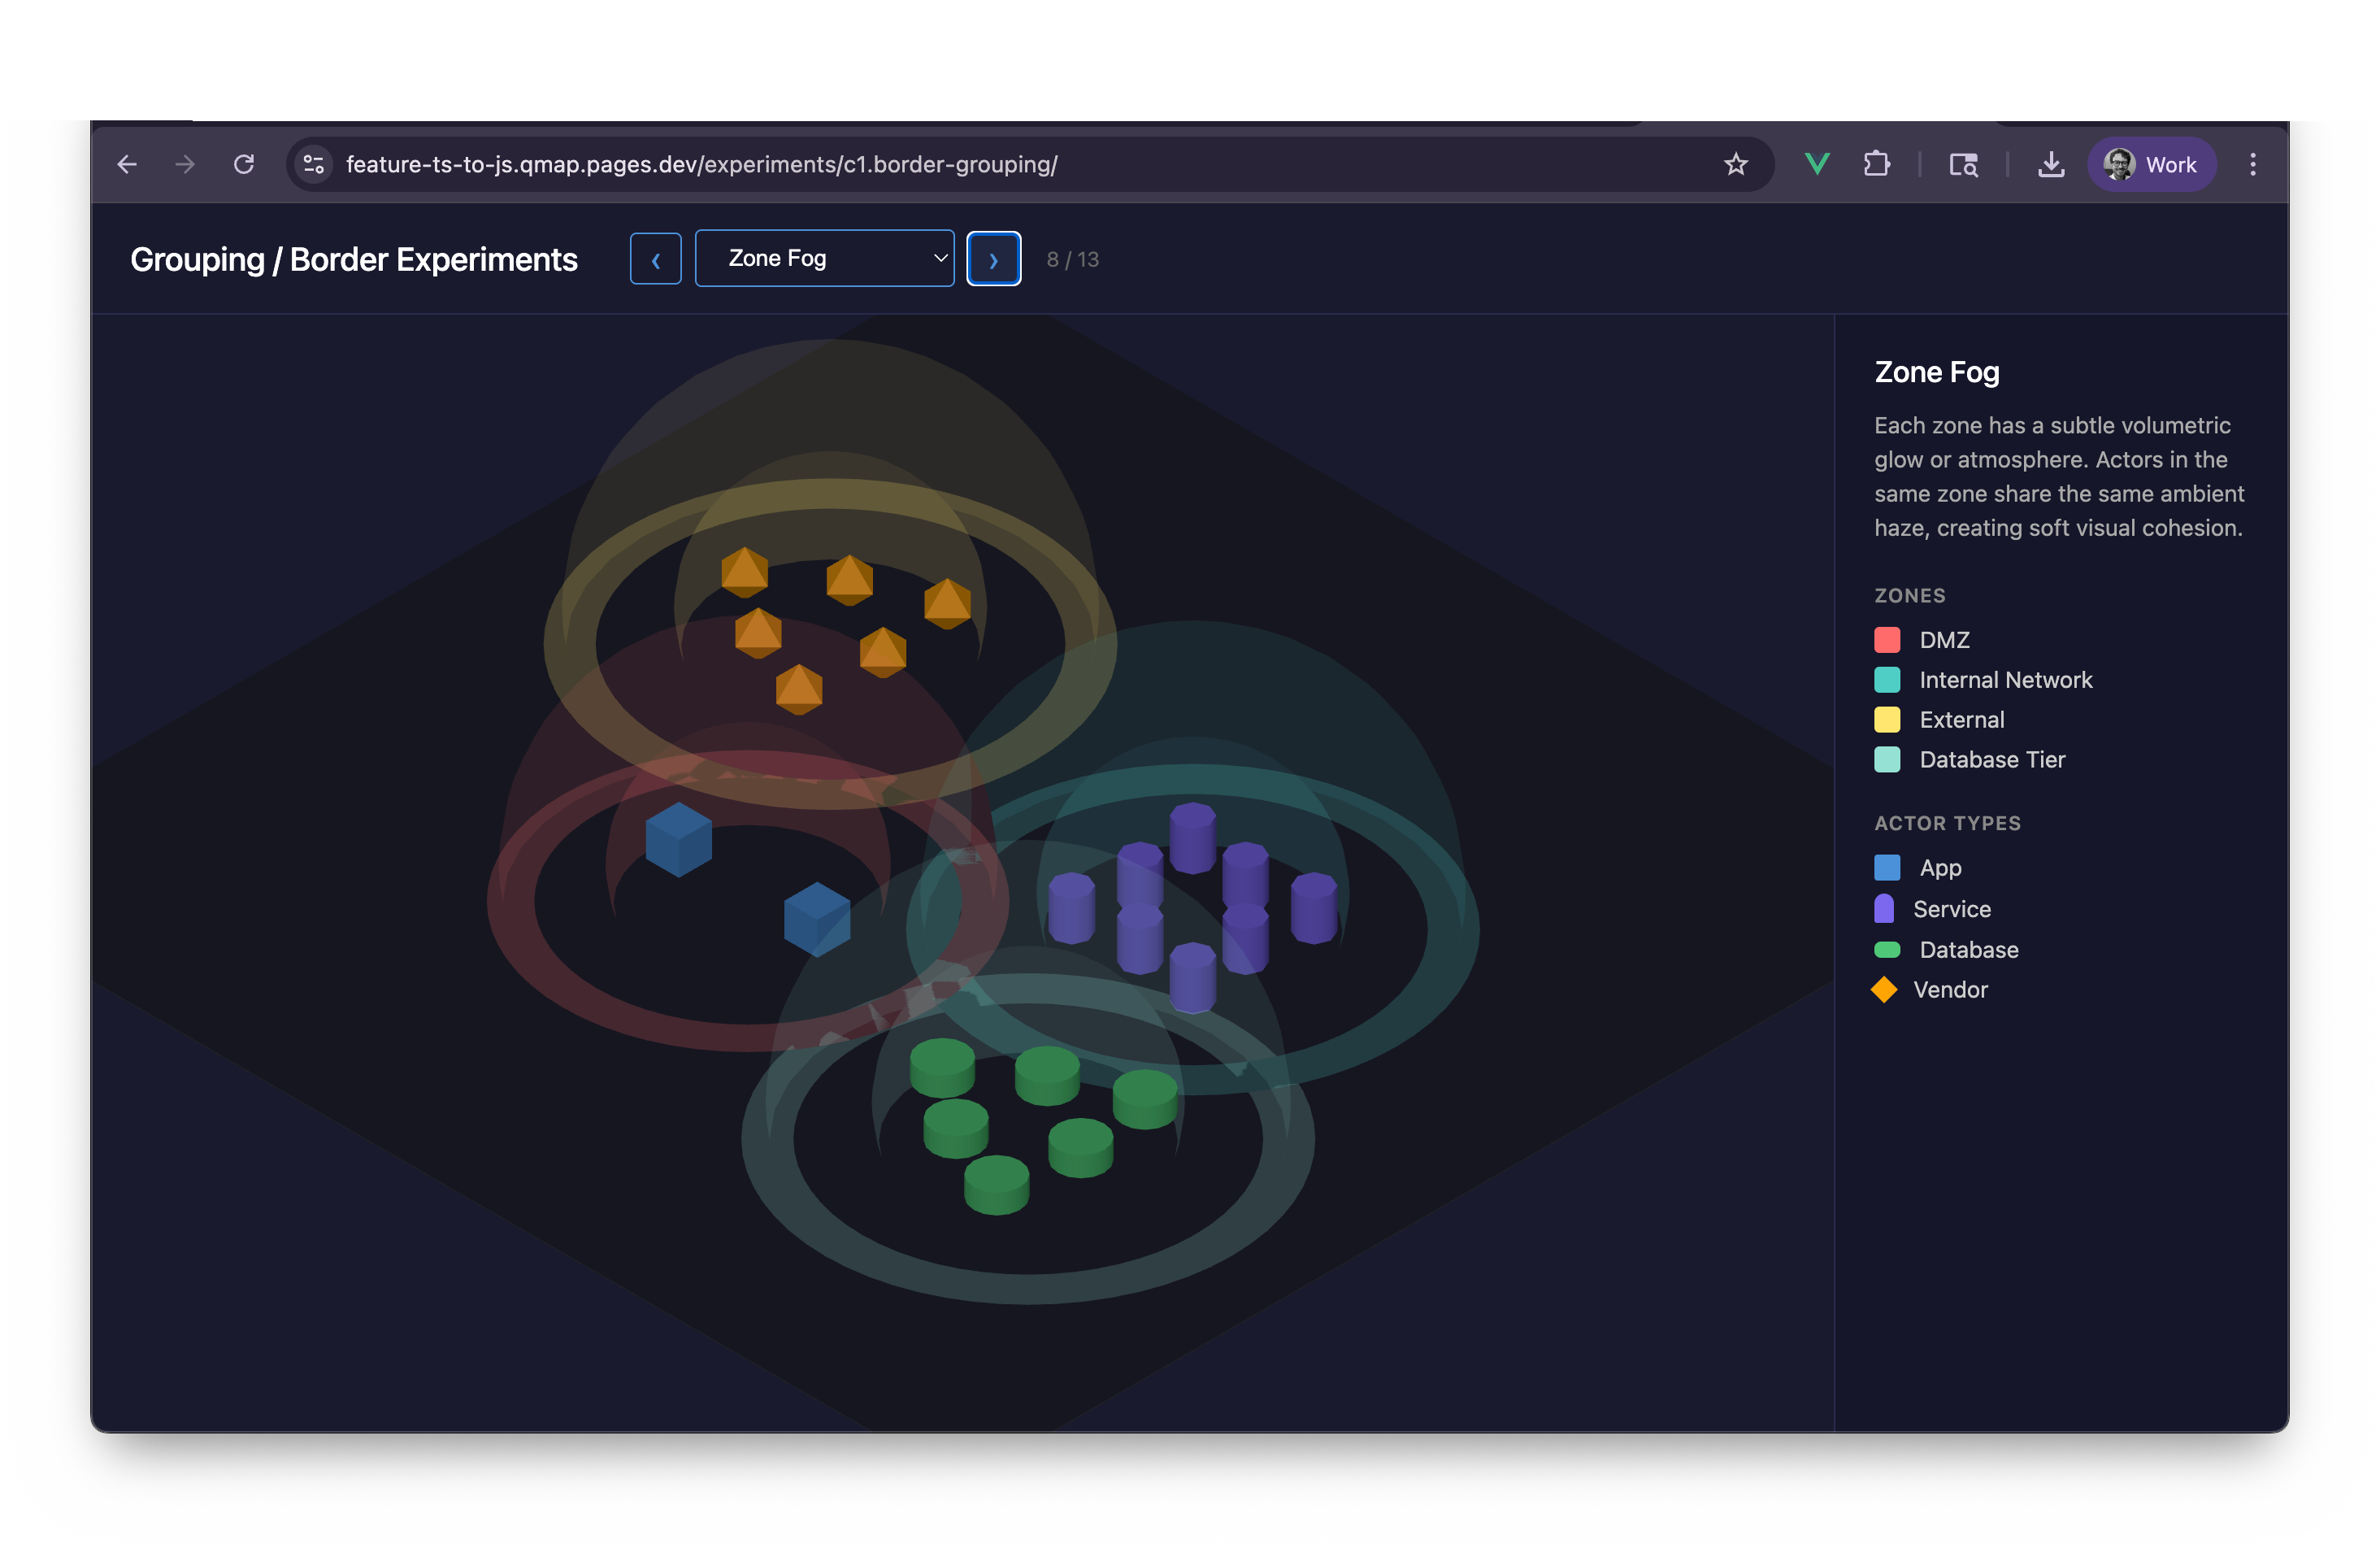
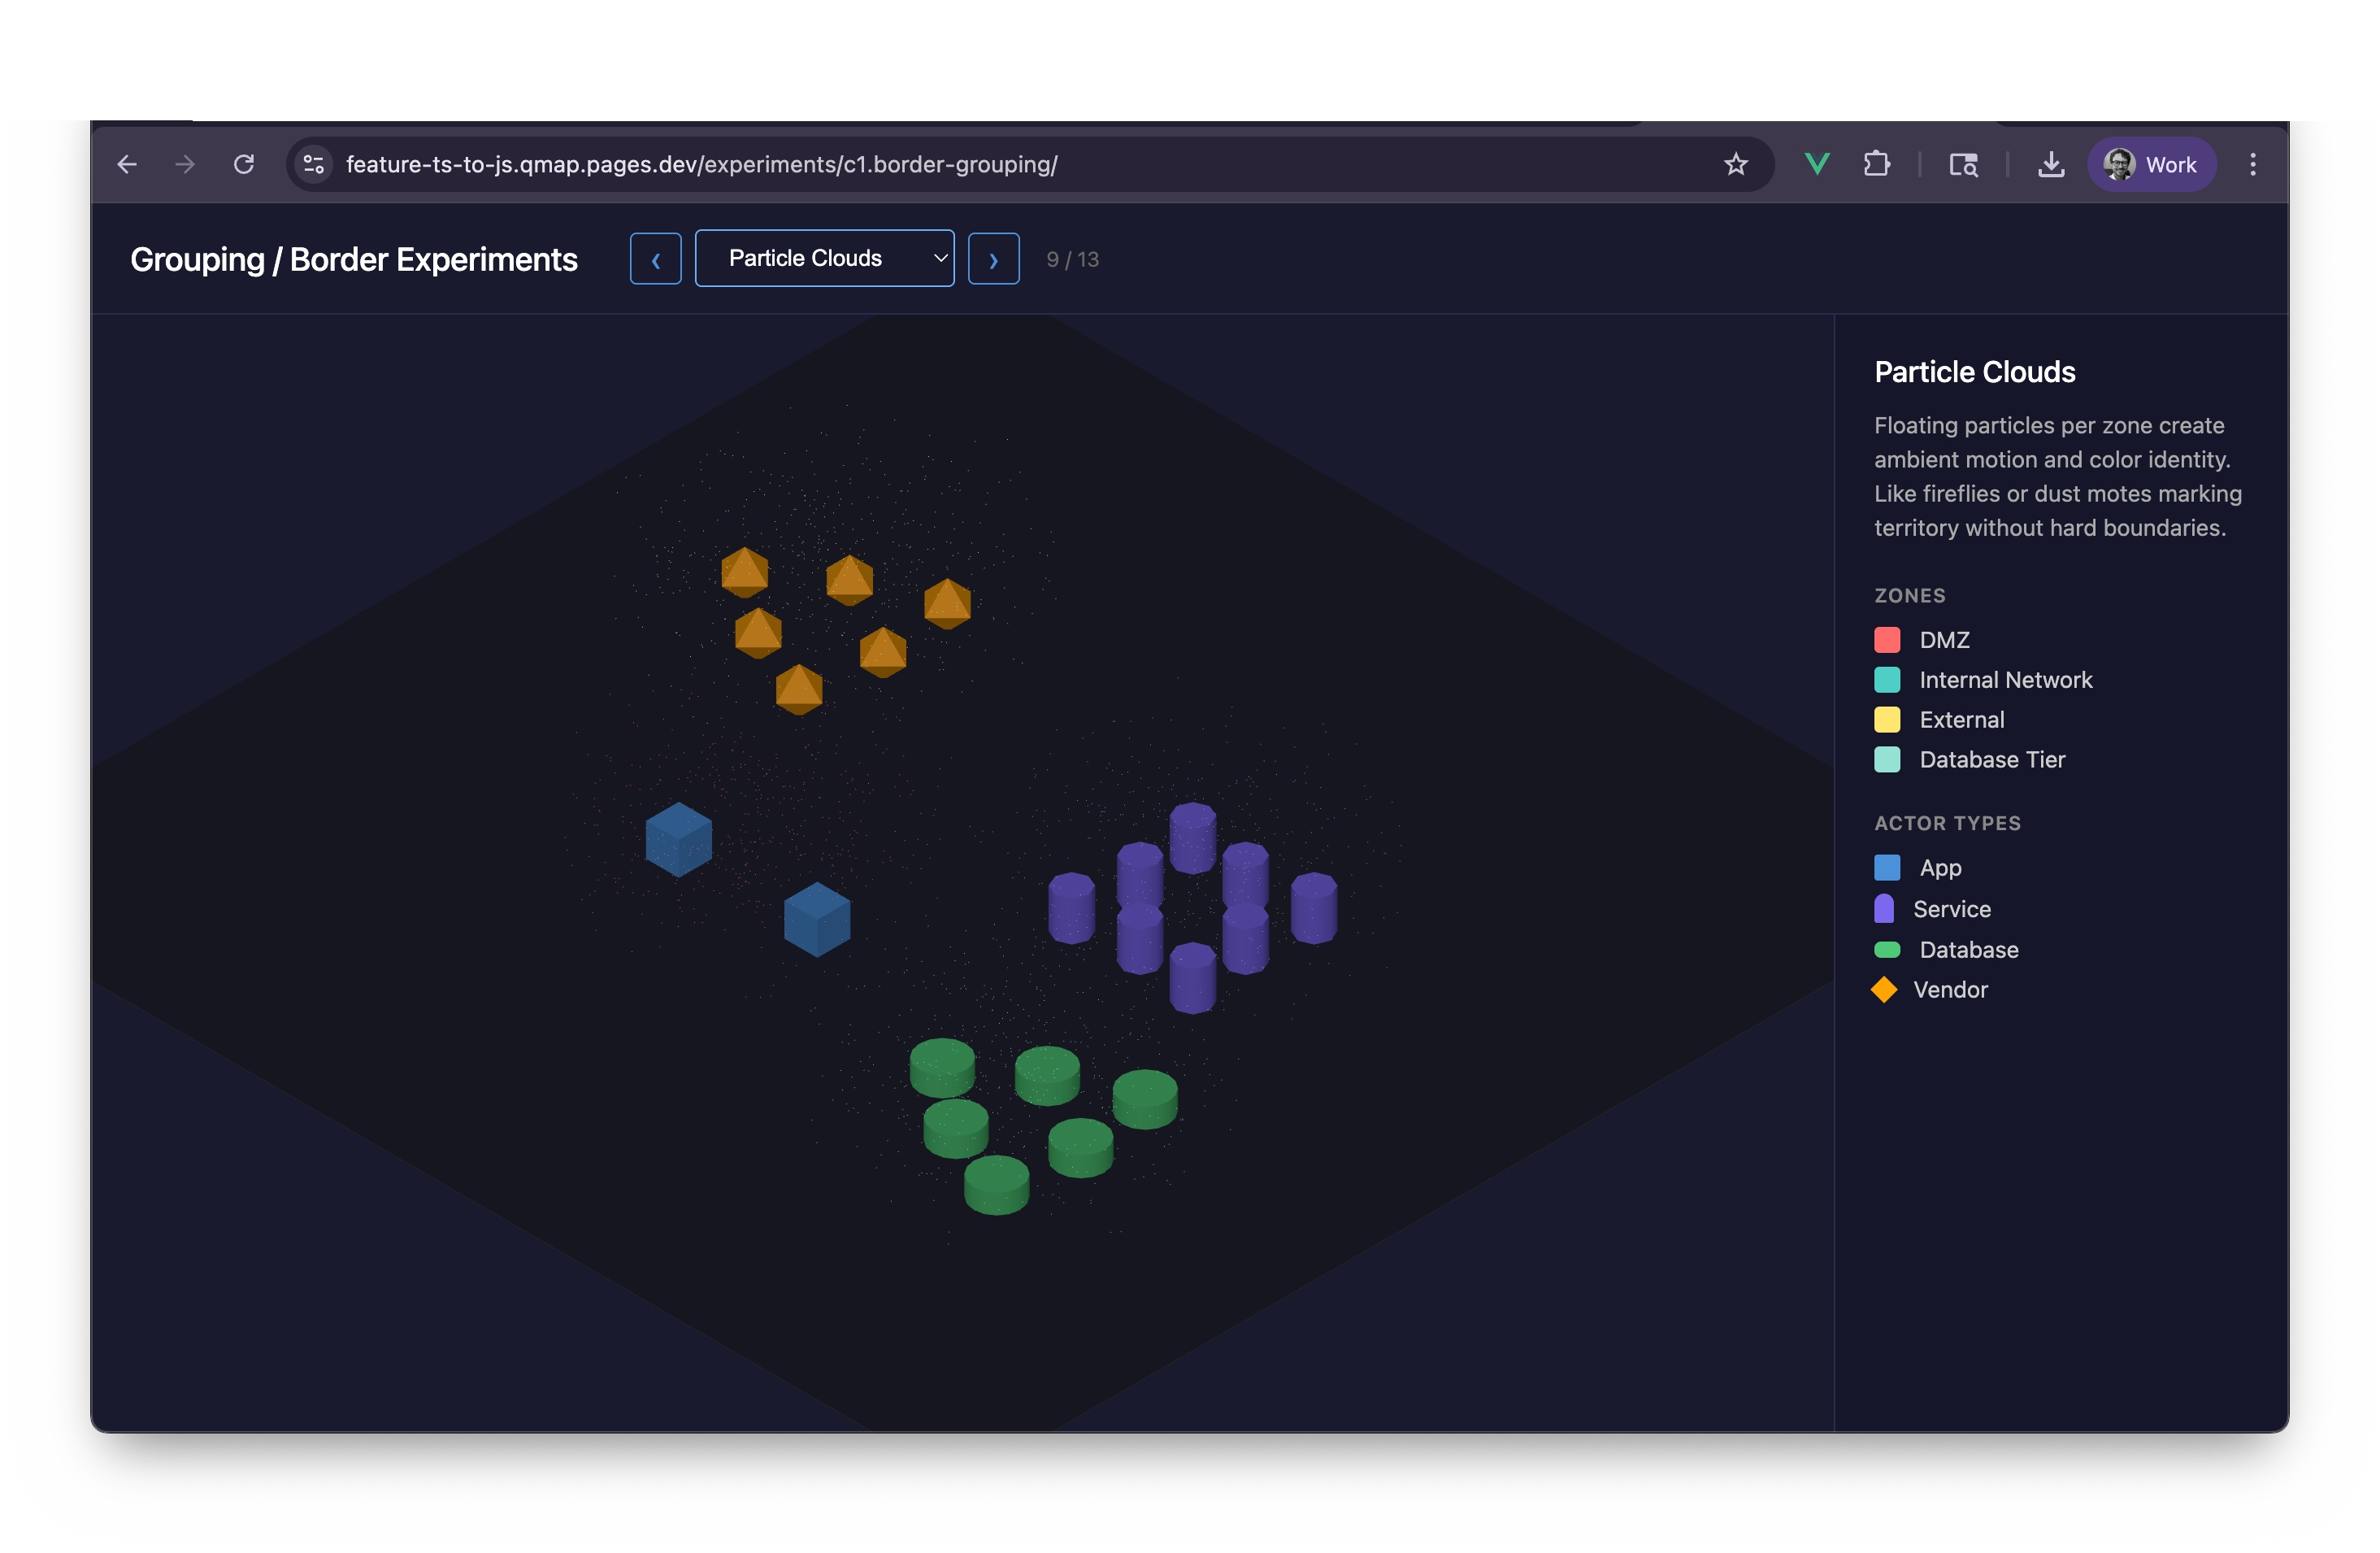
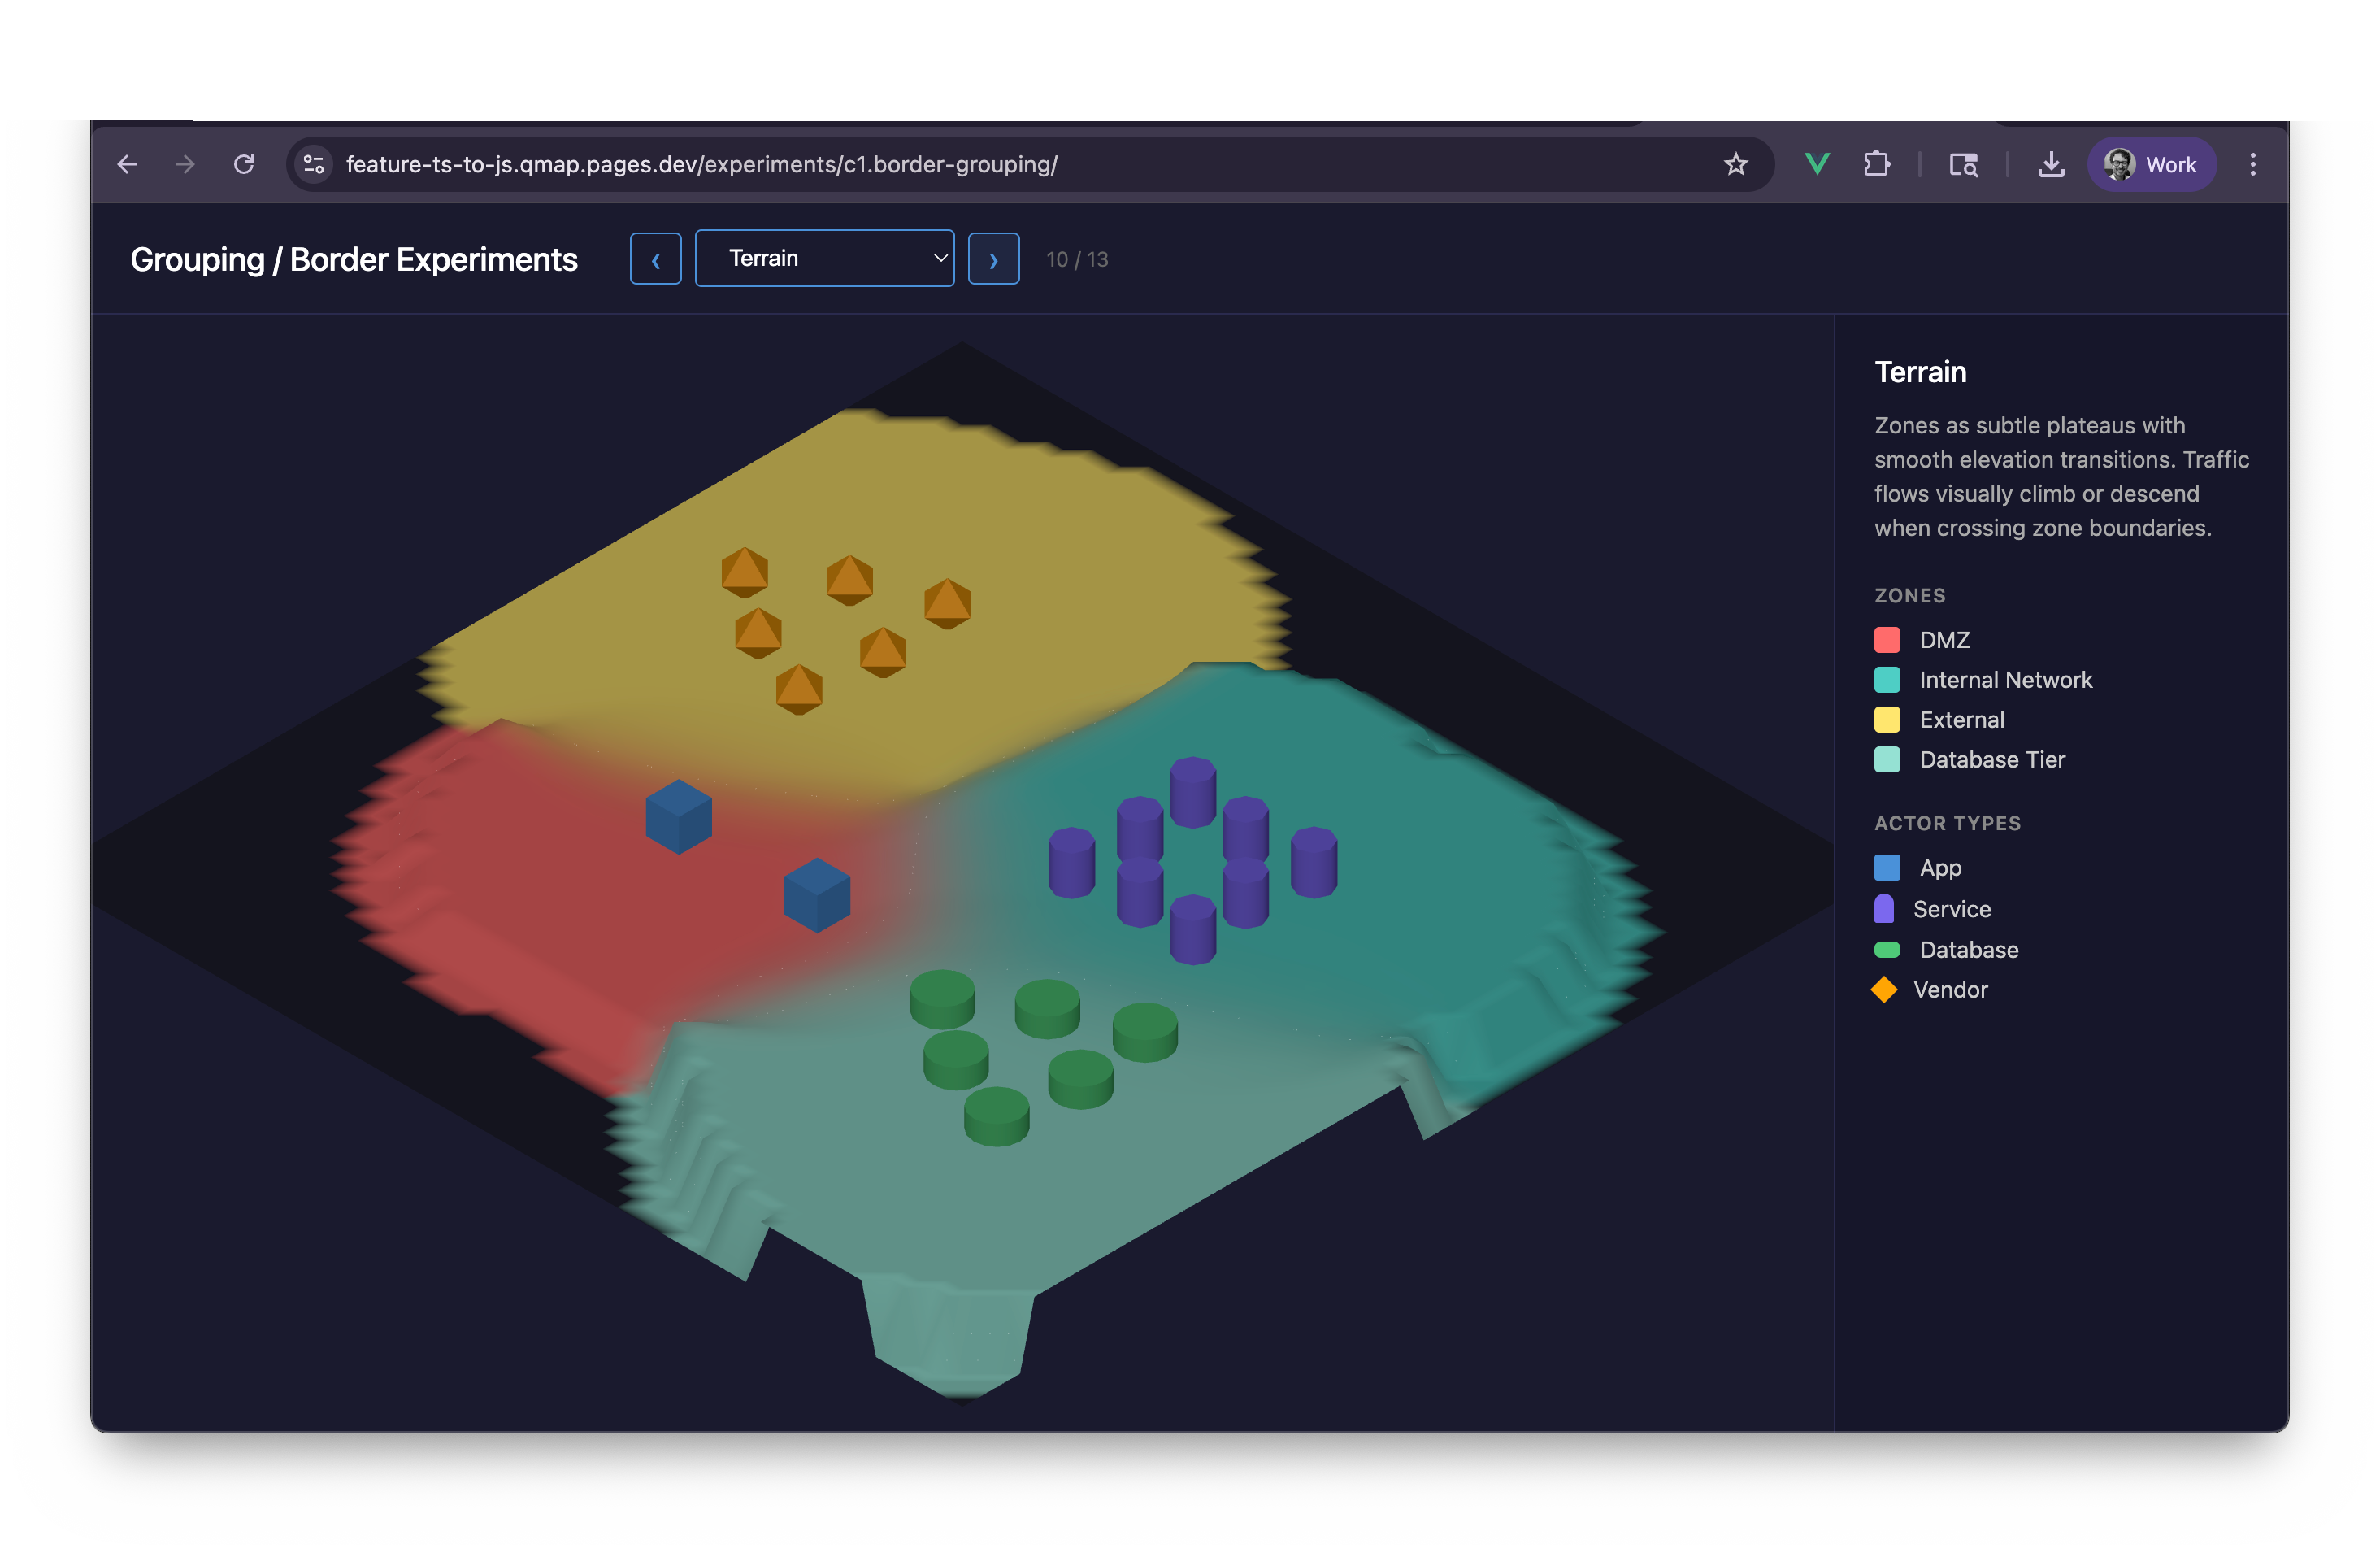
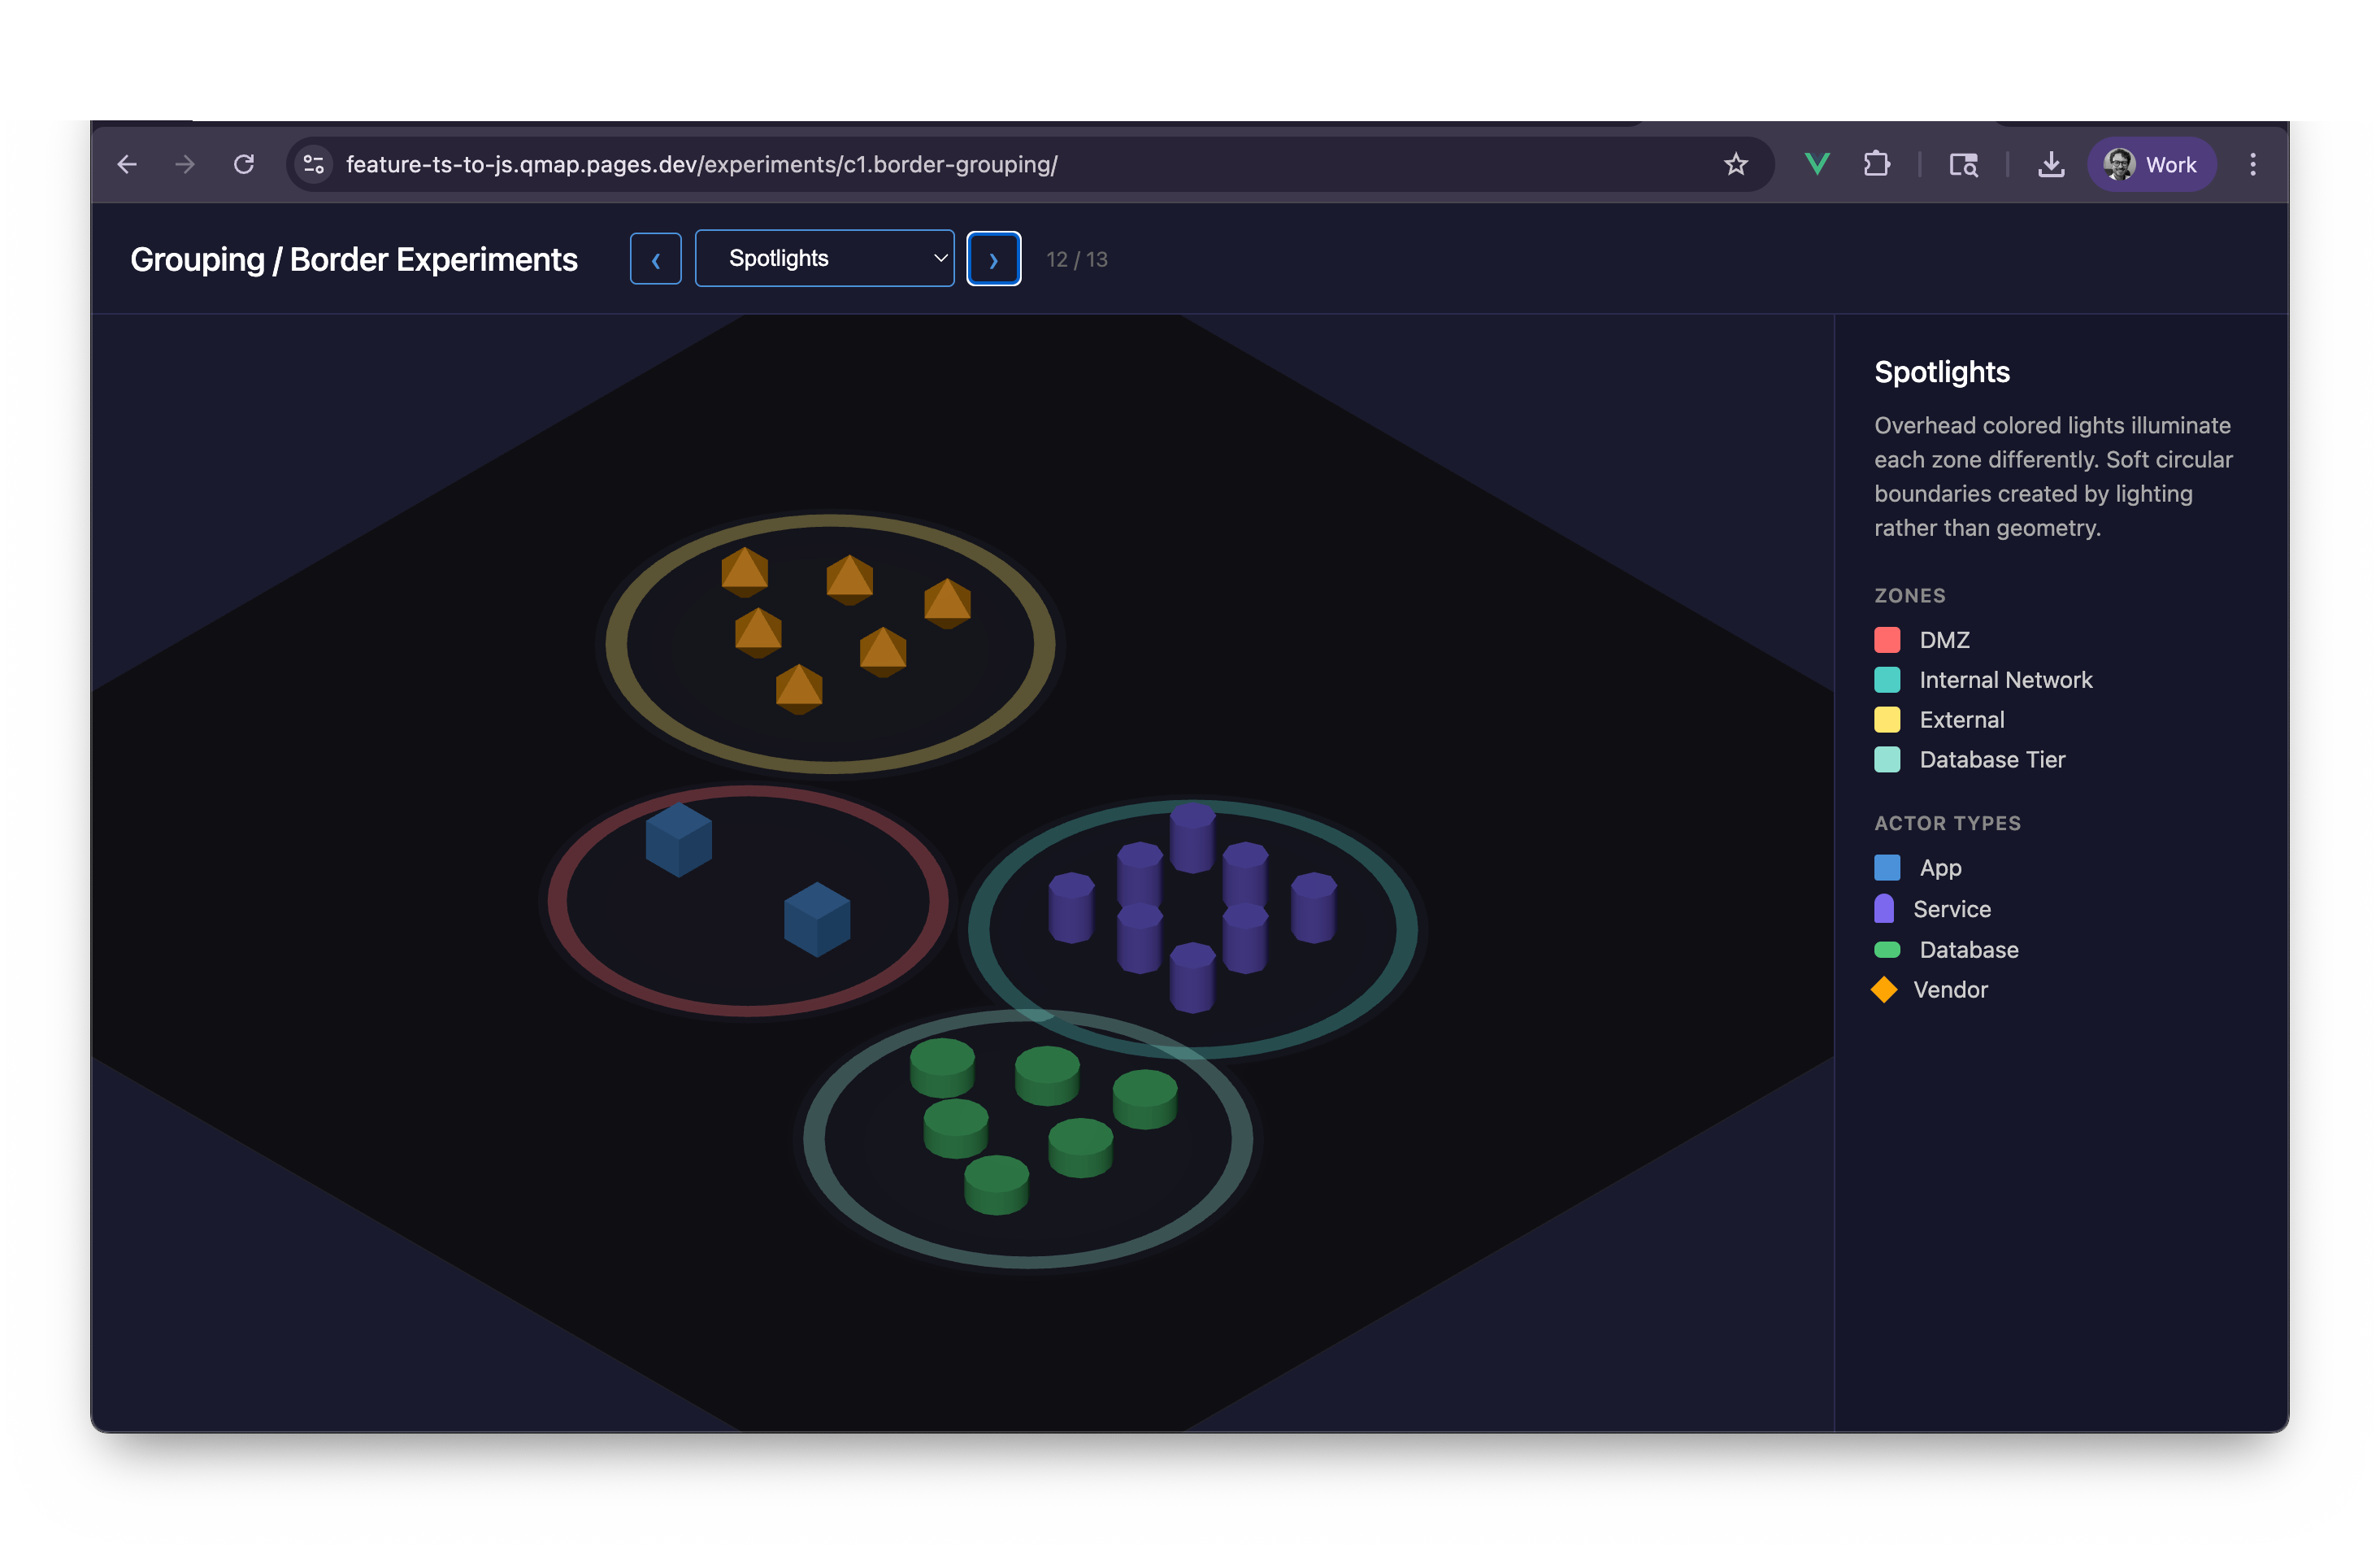
Explore 13 border/zone visualization strategies and evaluate which best communicate boundaries without overwhelming the traffic flow visualization.
23 captures — heroes, page slices, and full-page renders. Click to view.
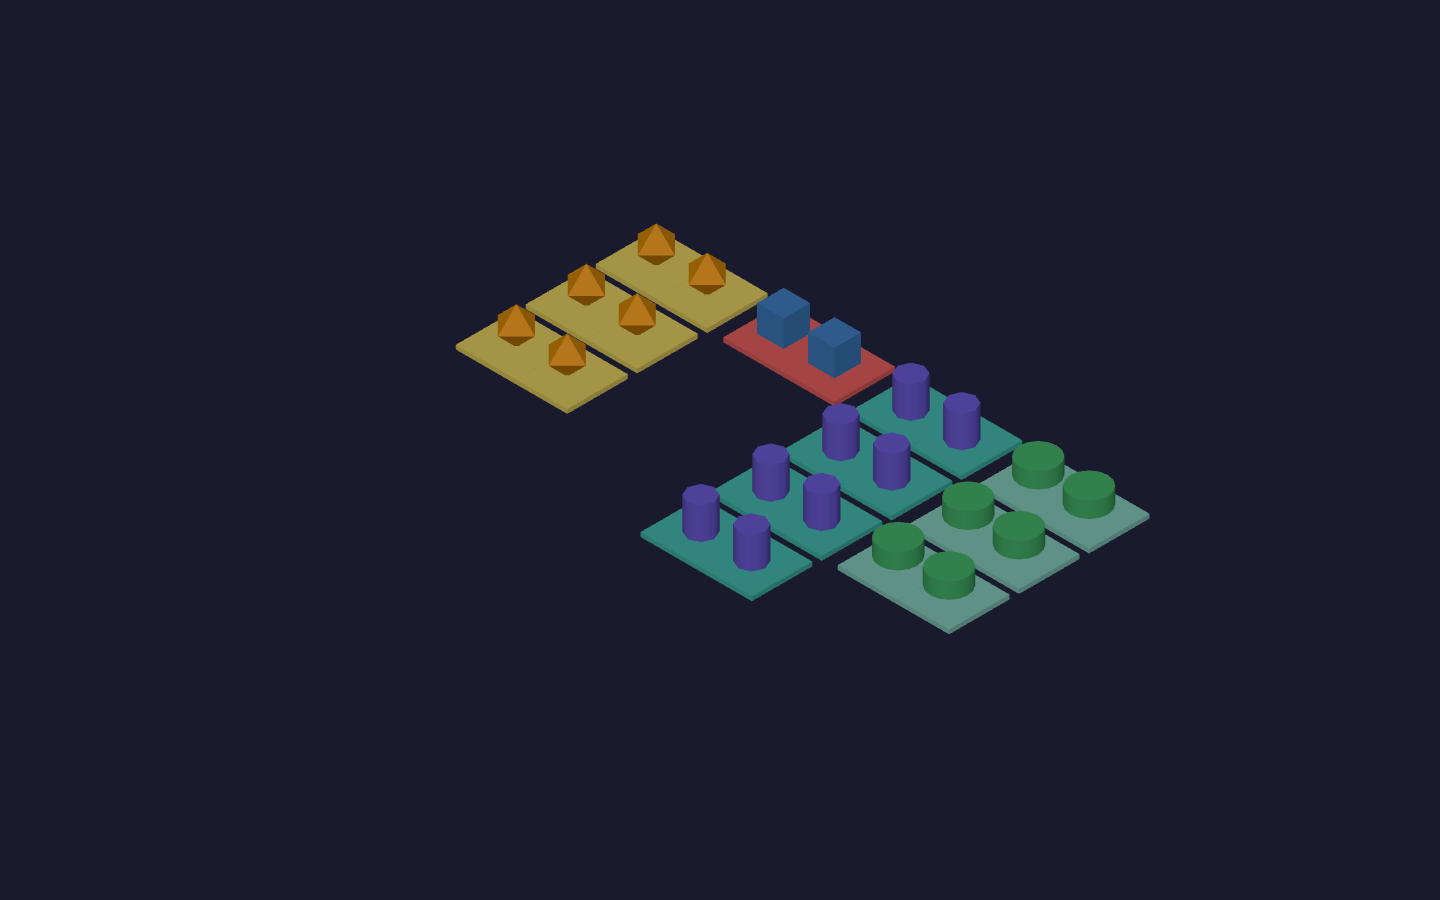
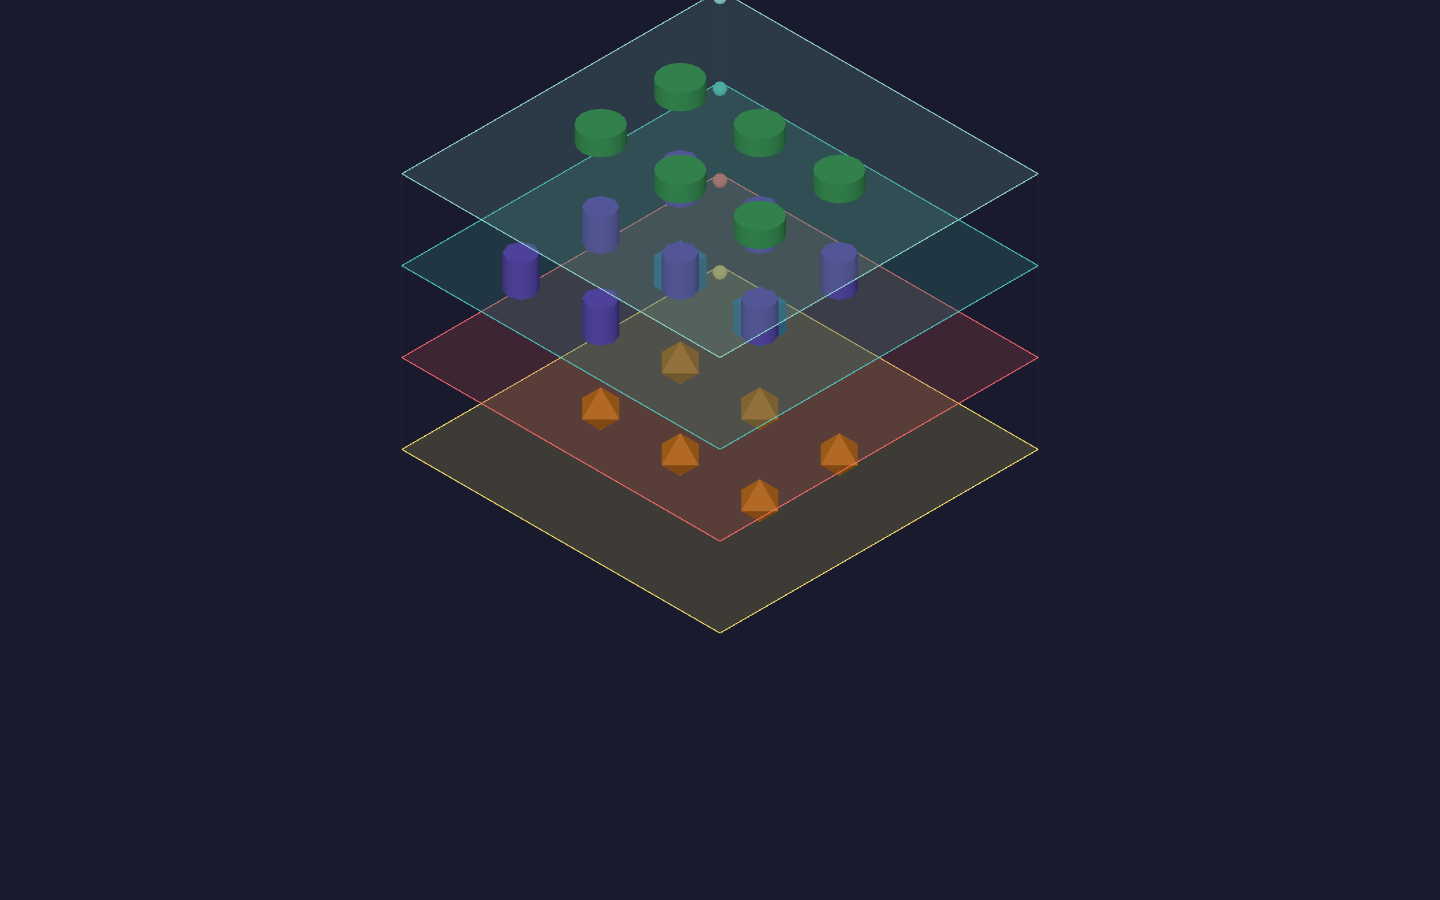
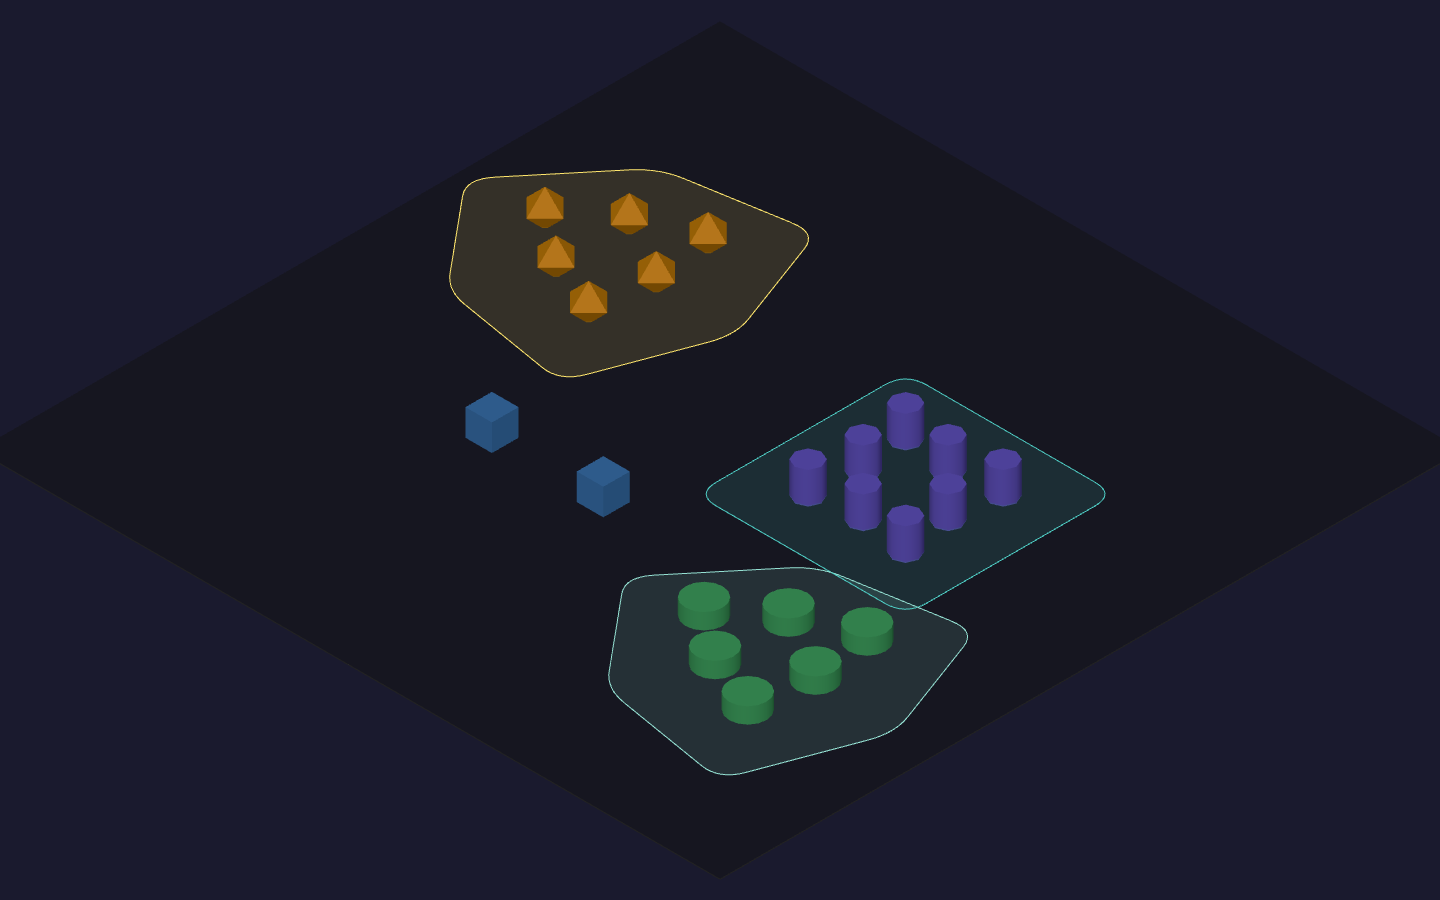
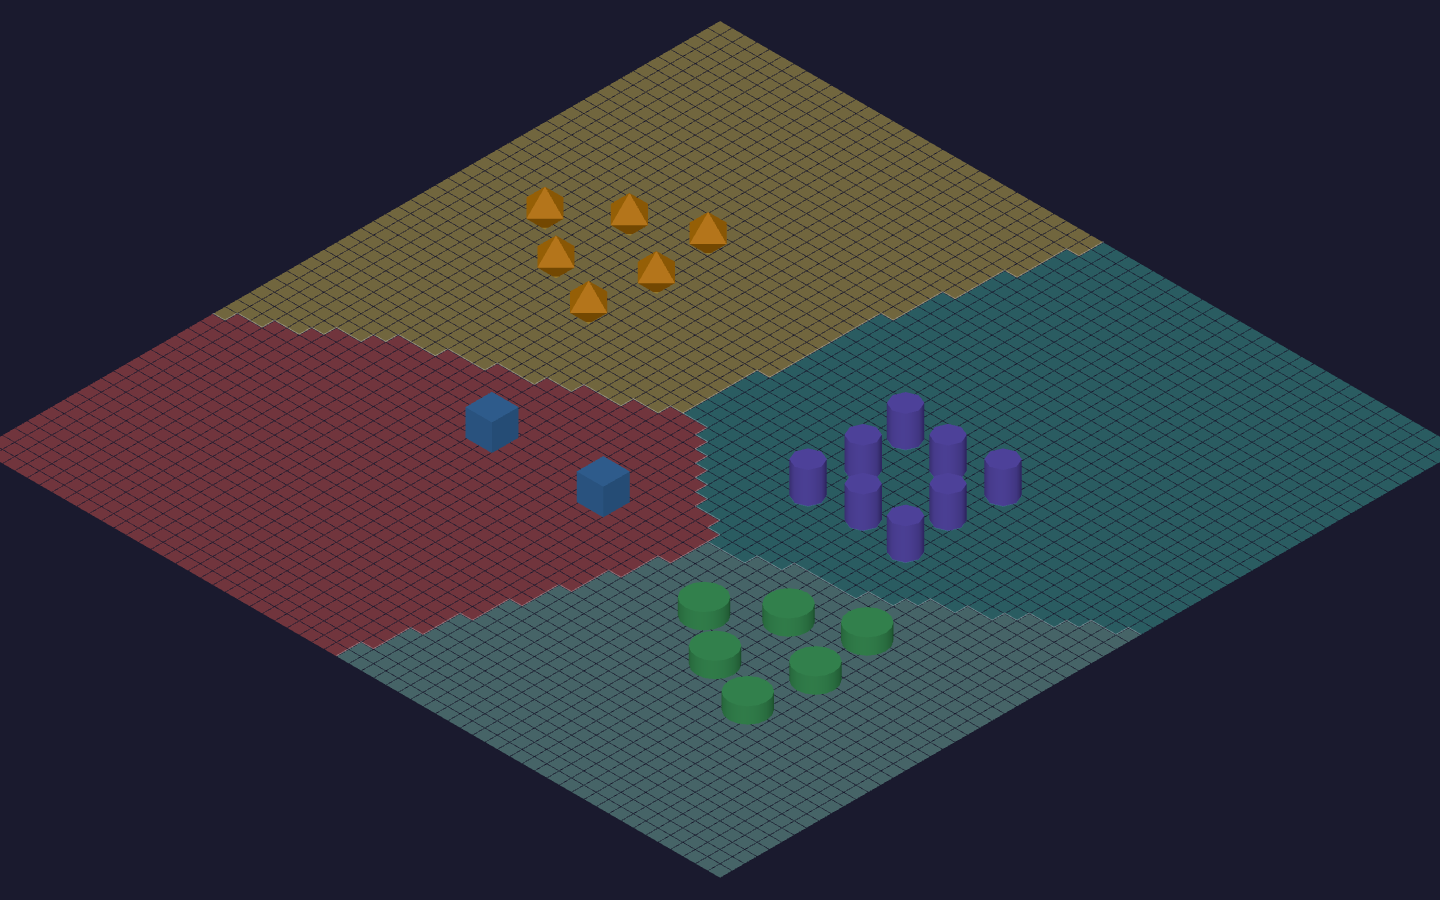
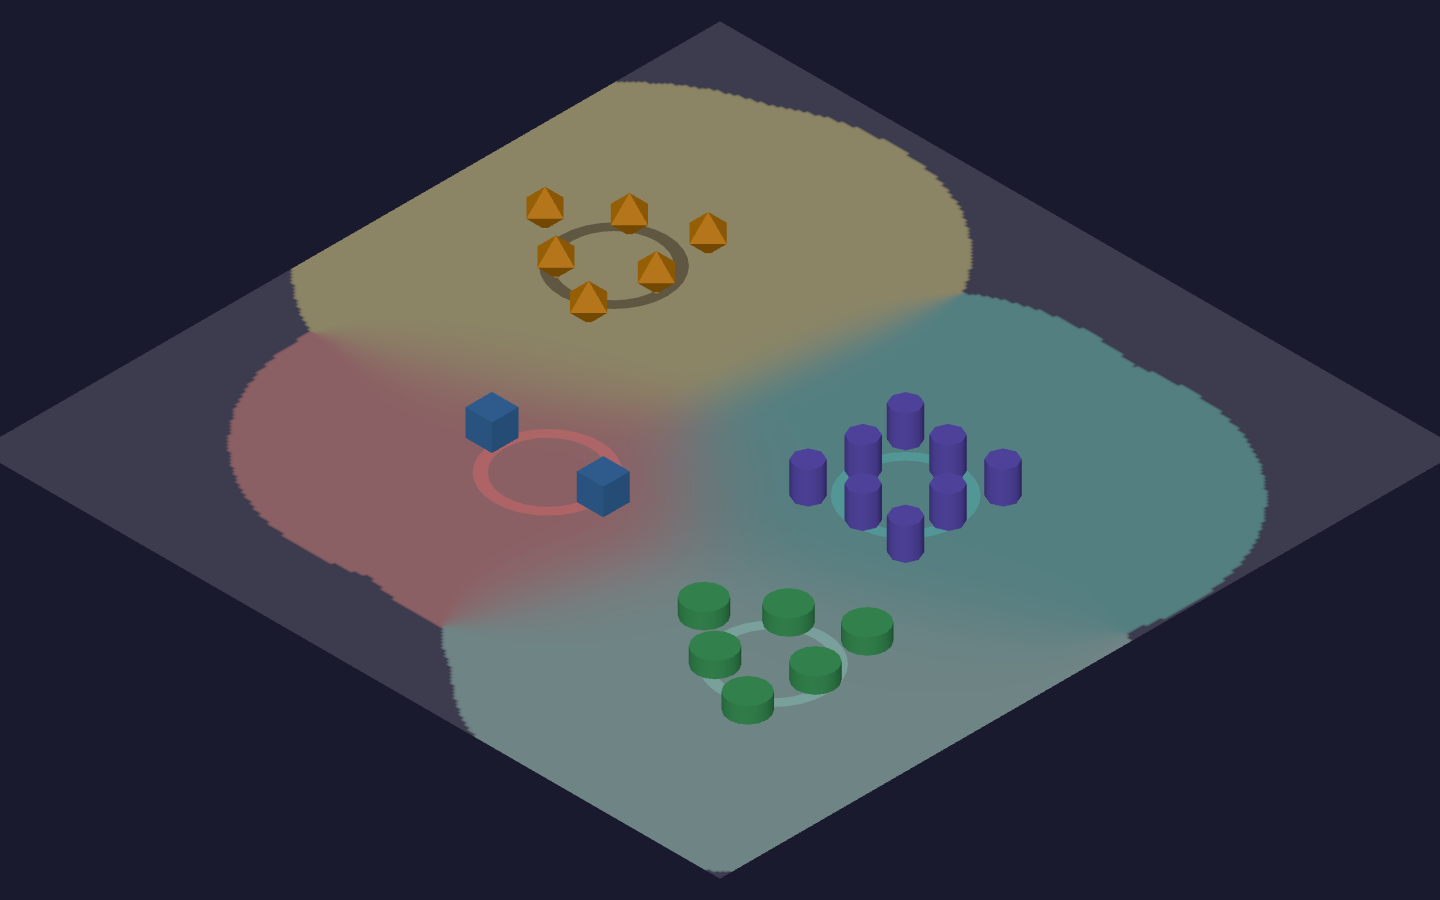
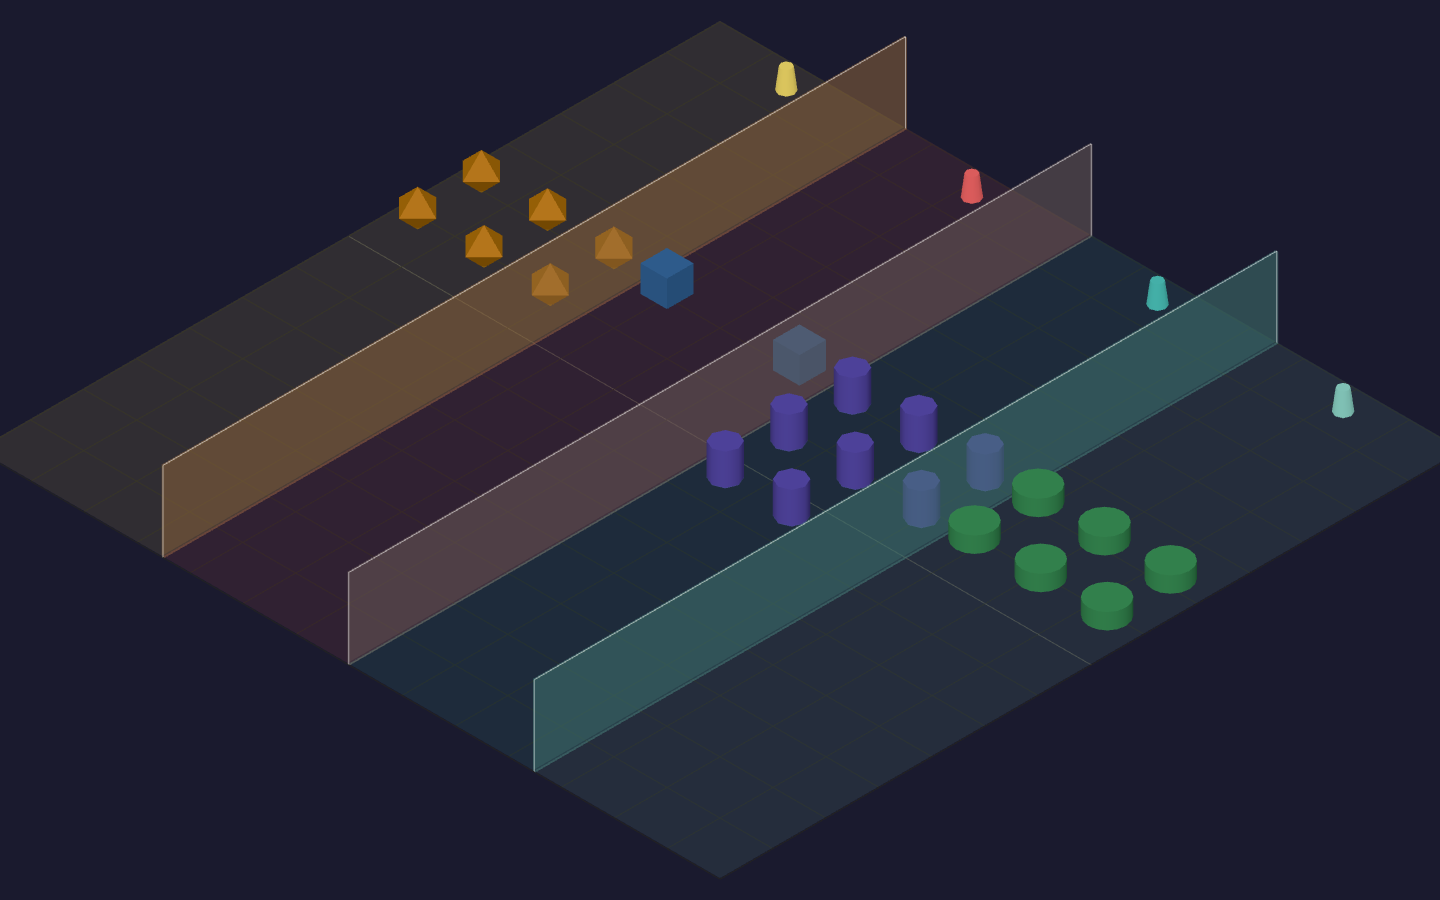
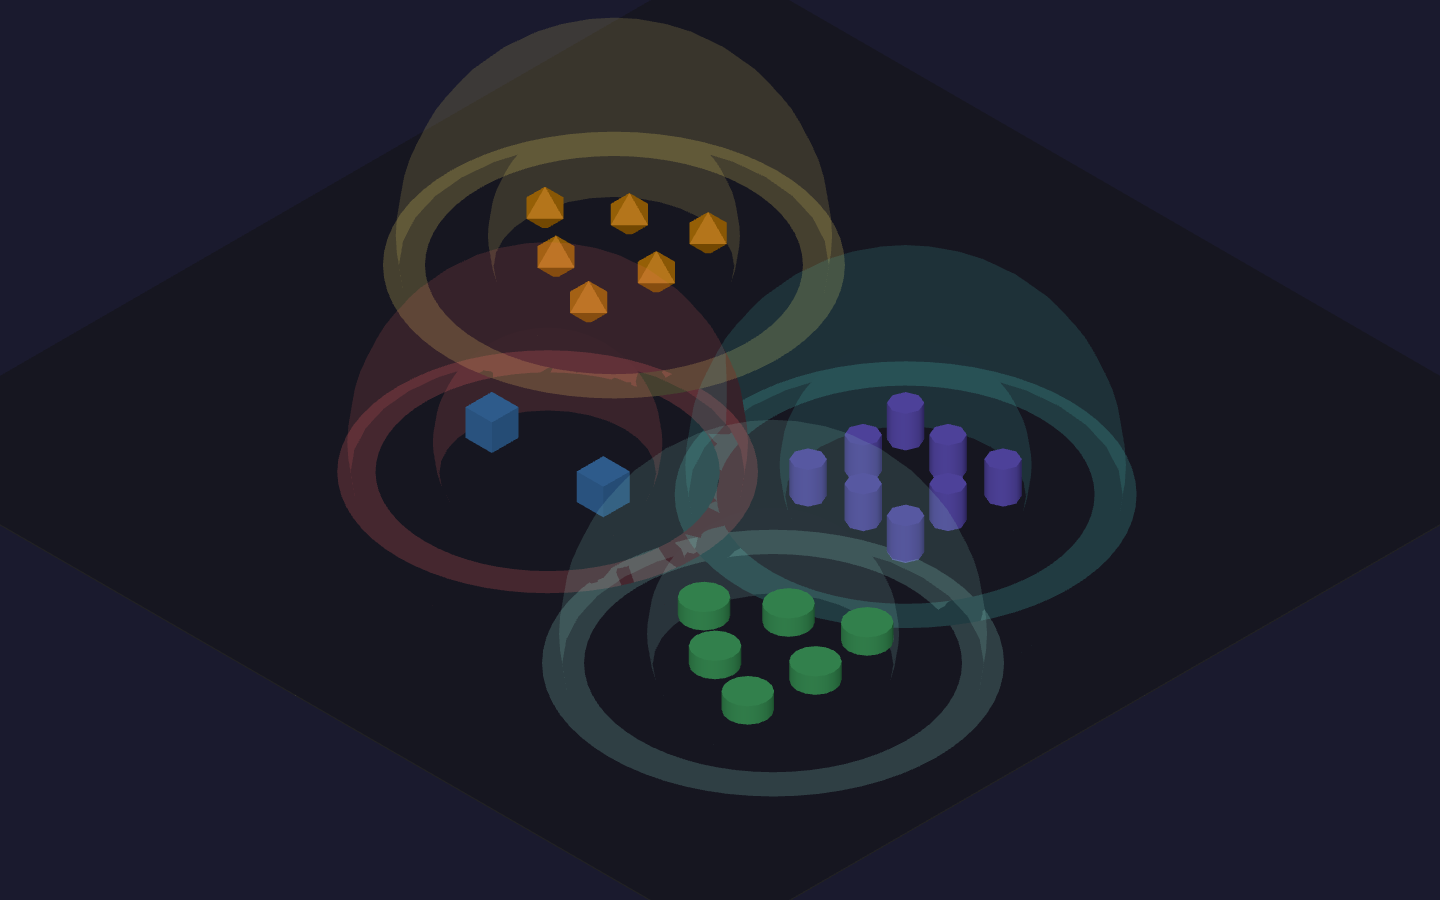
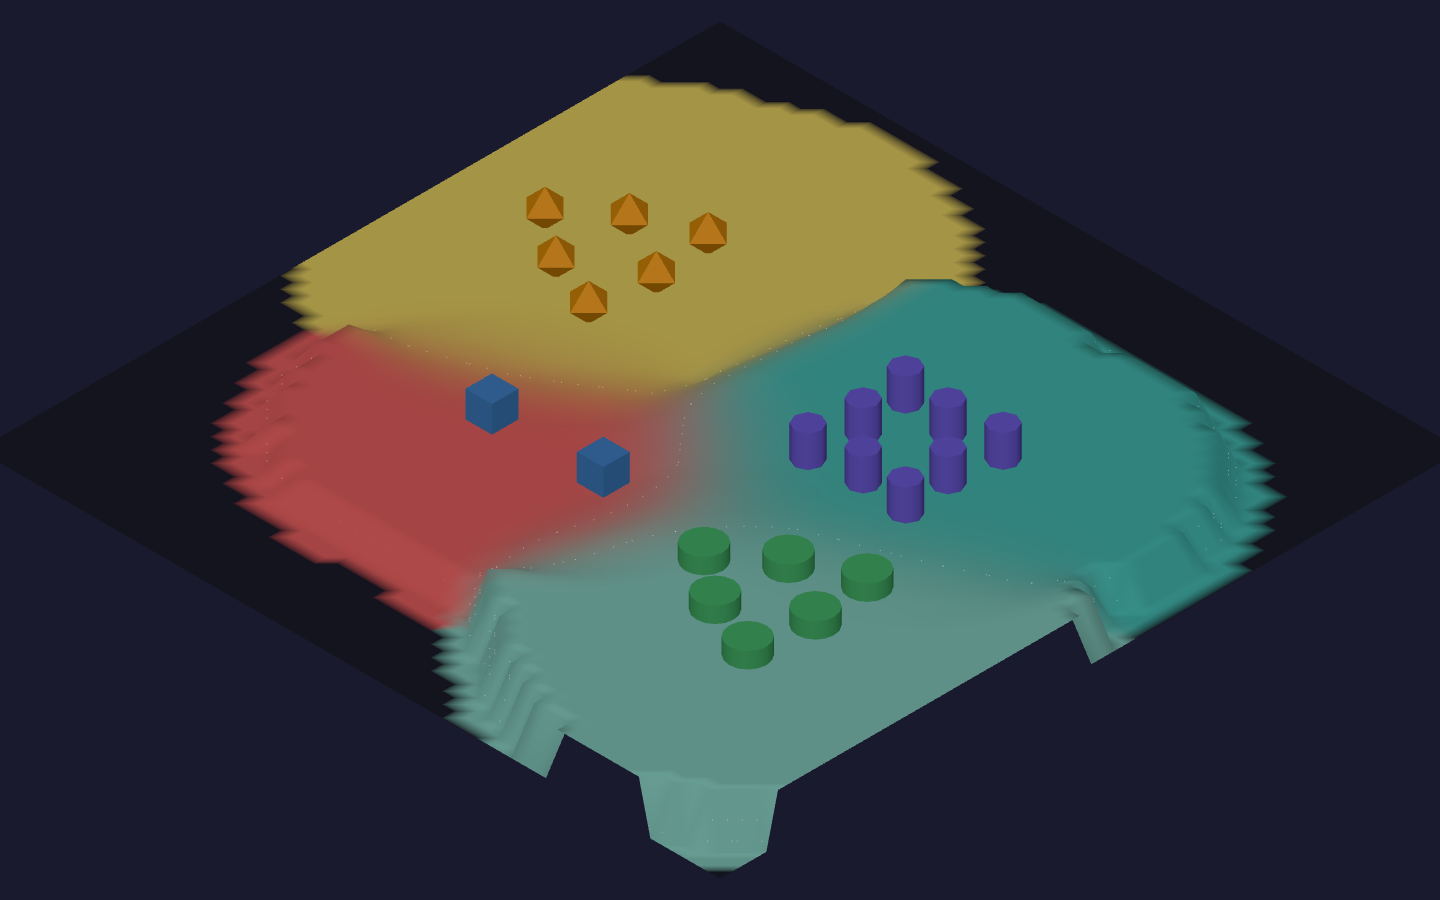
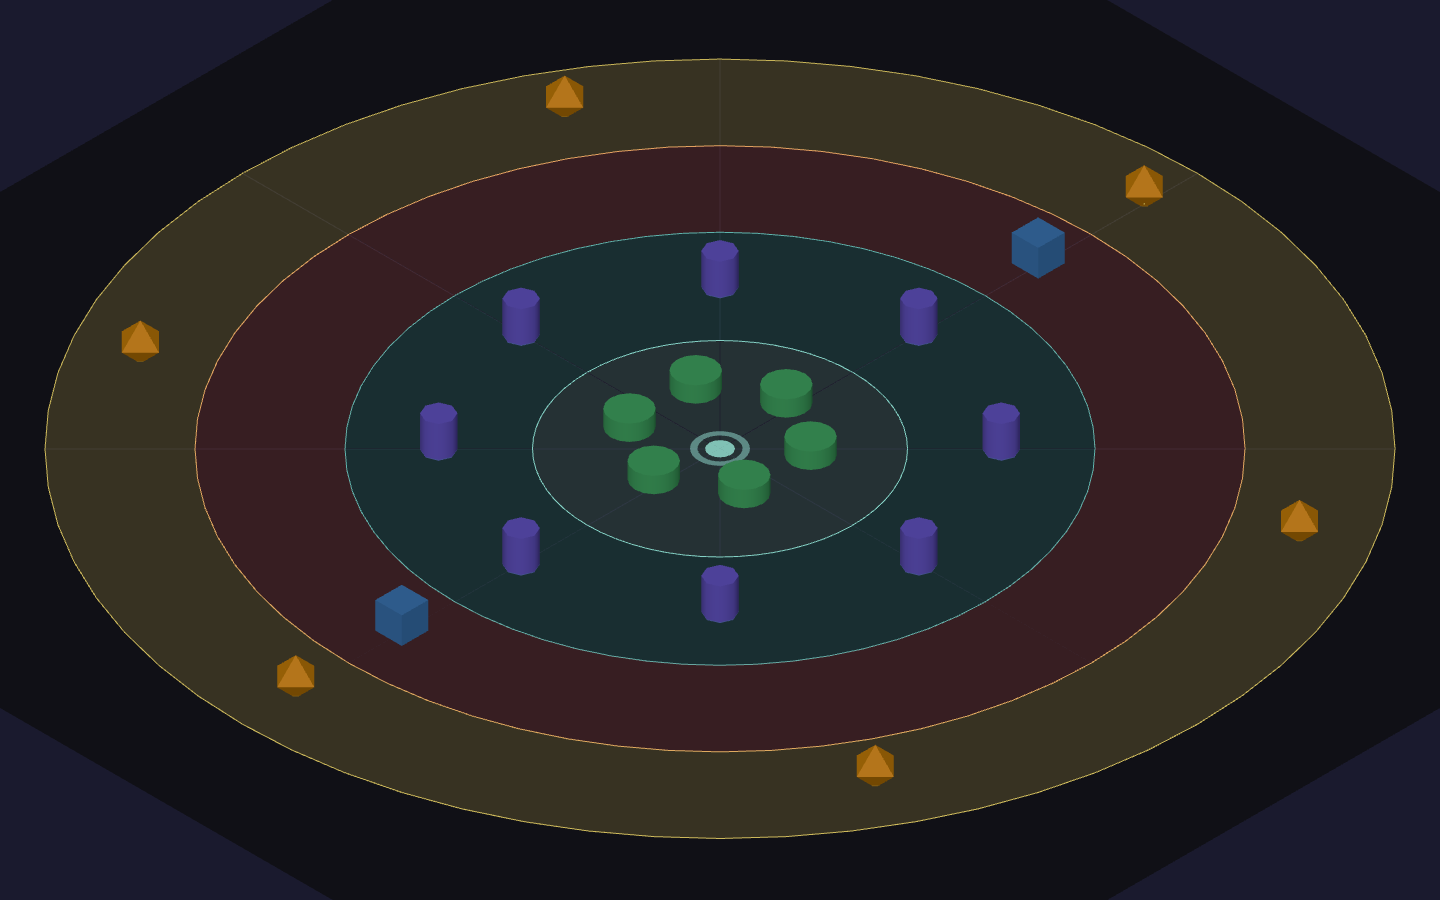
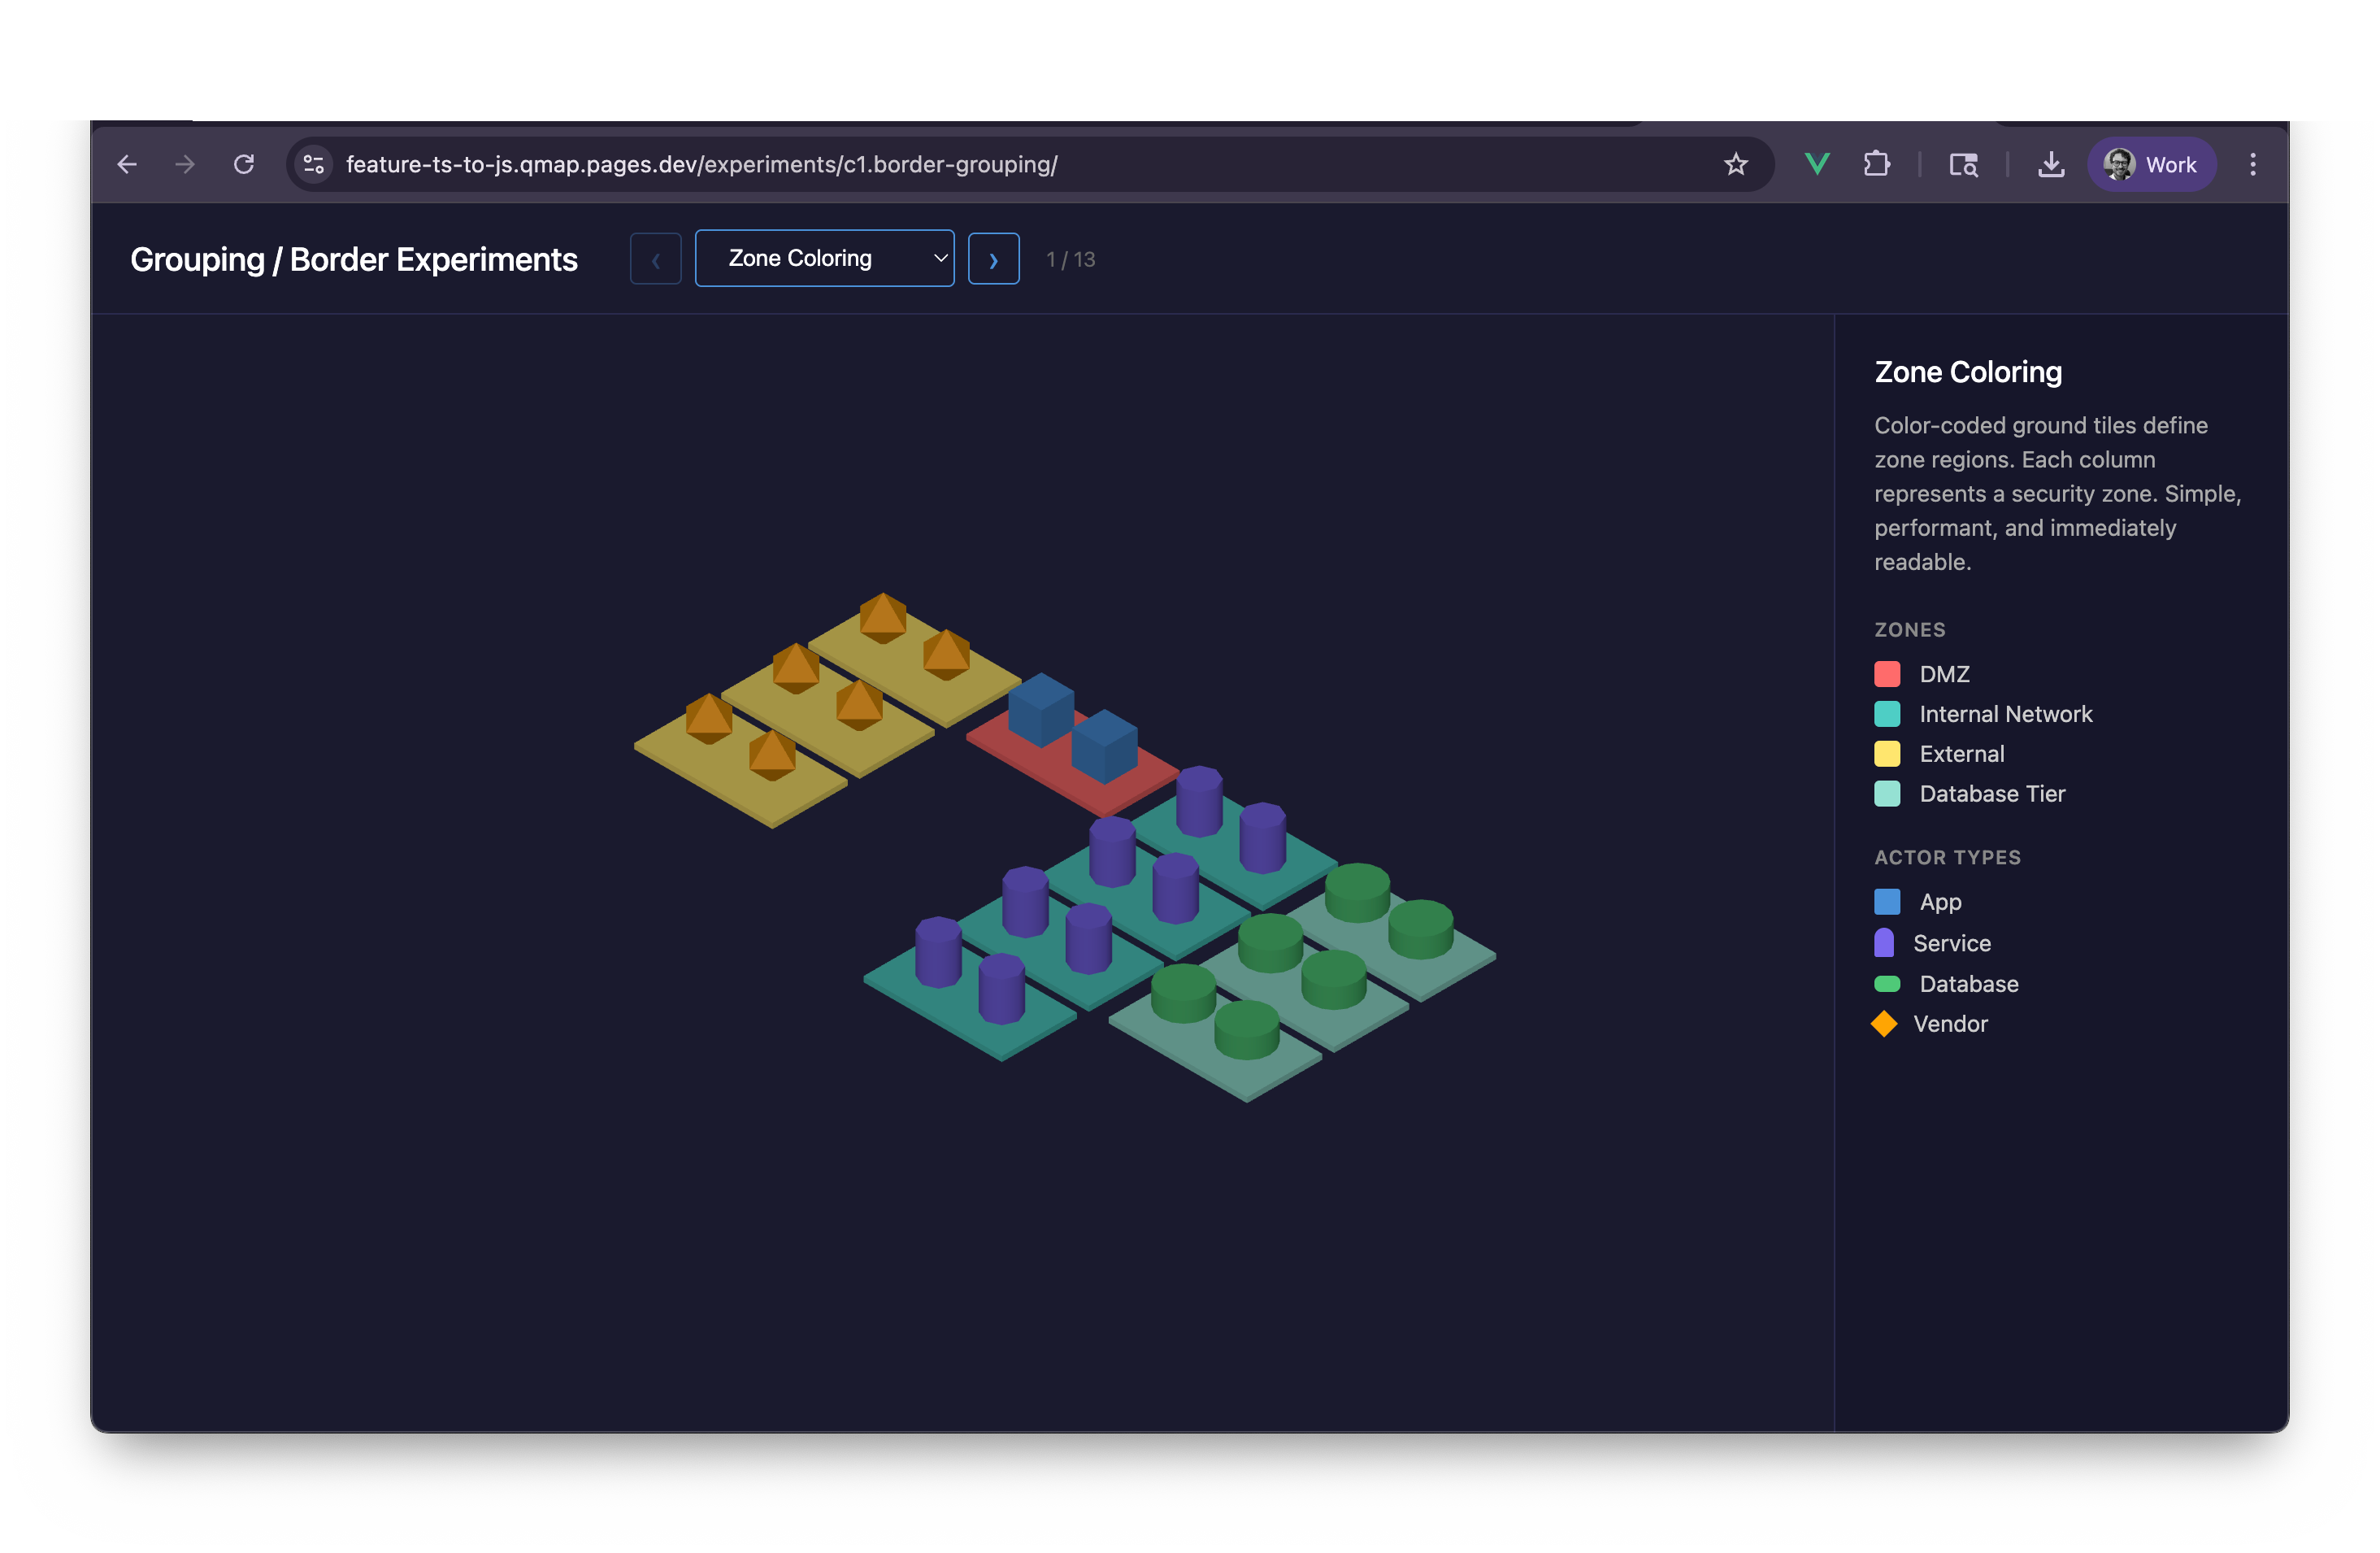
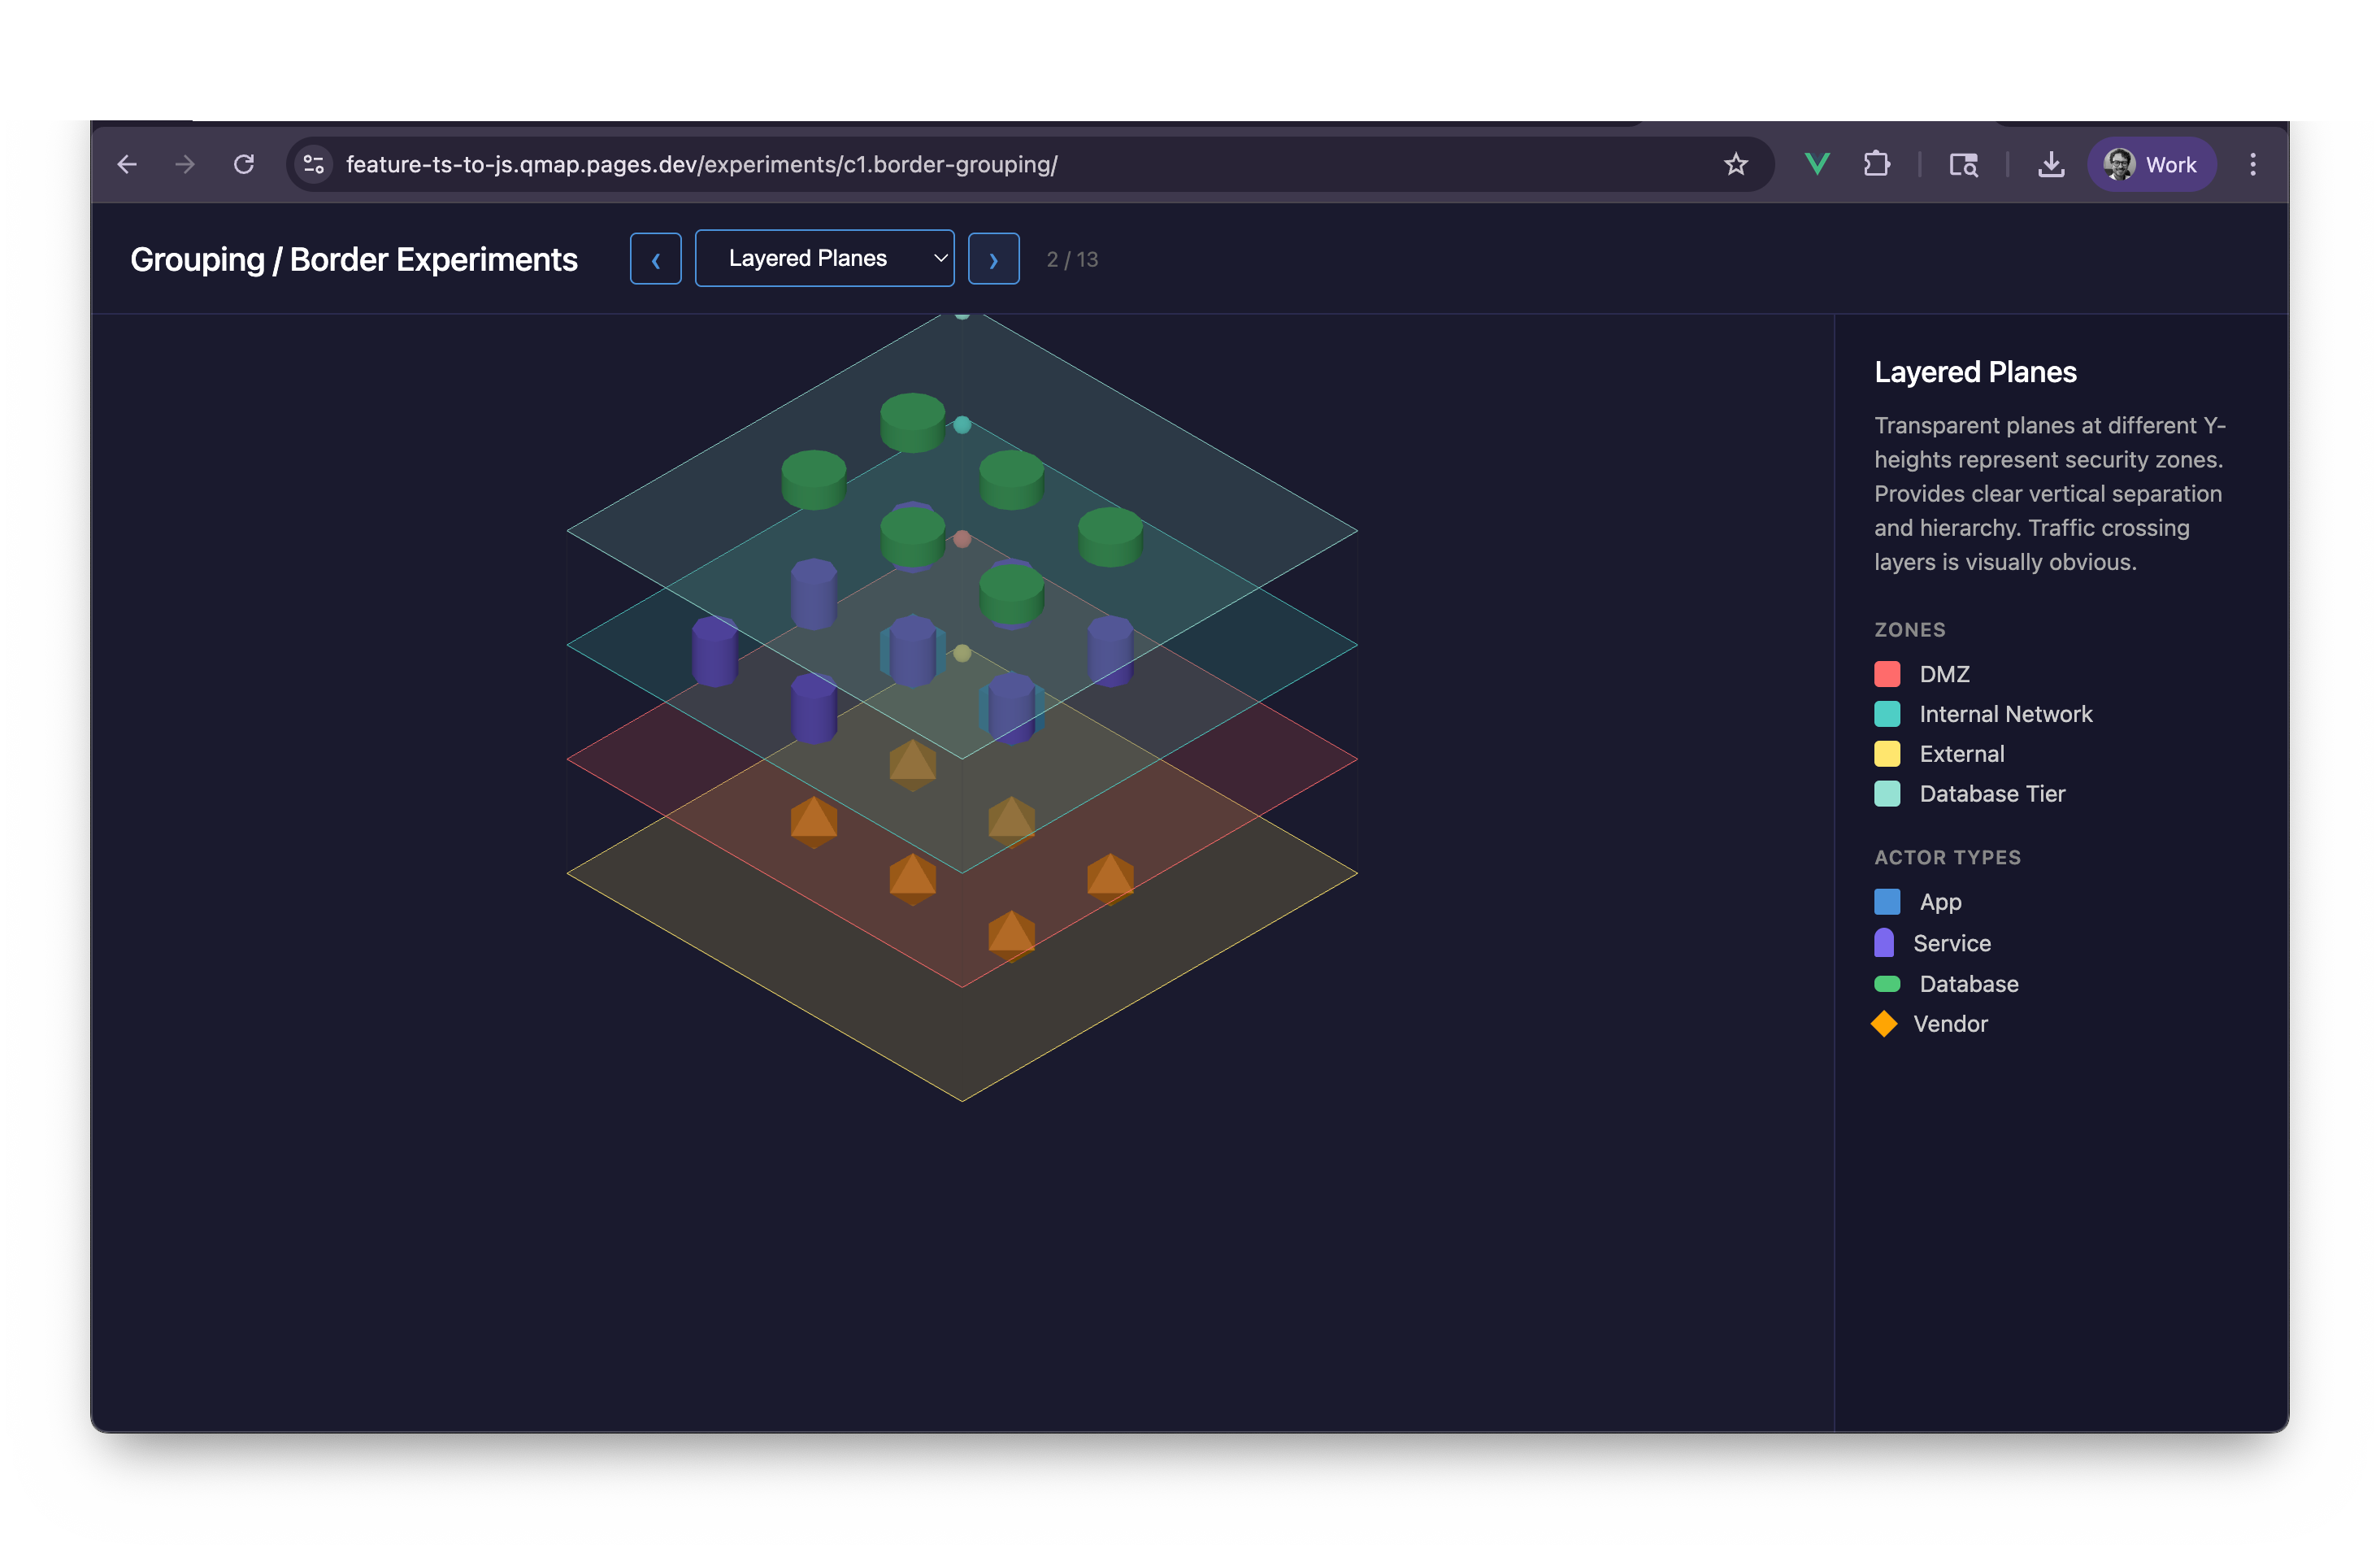
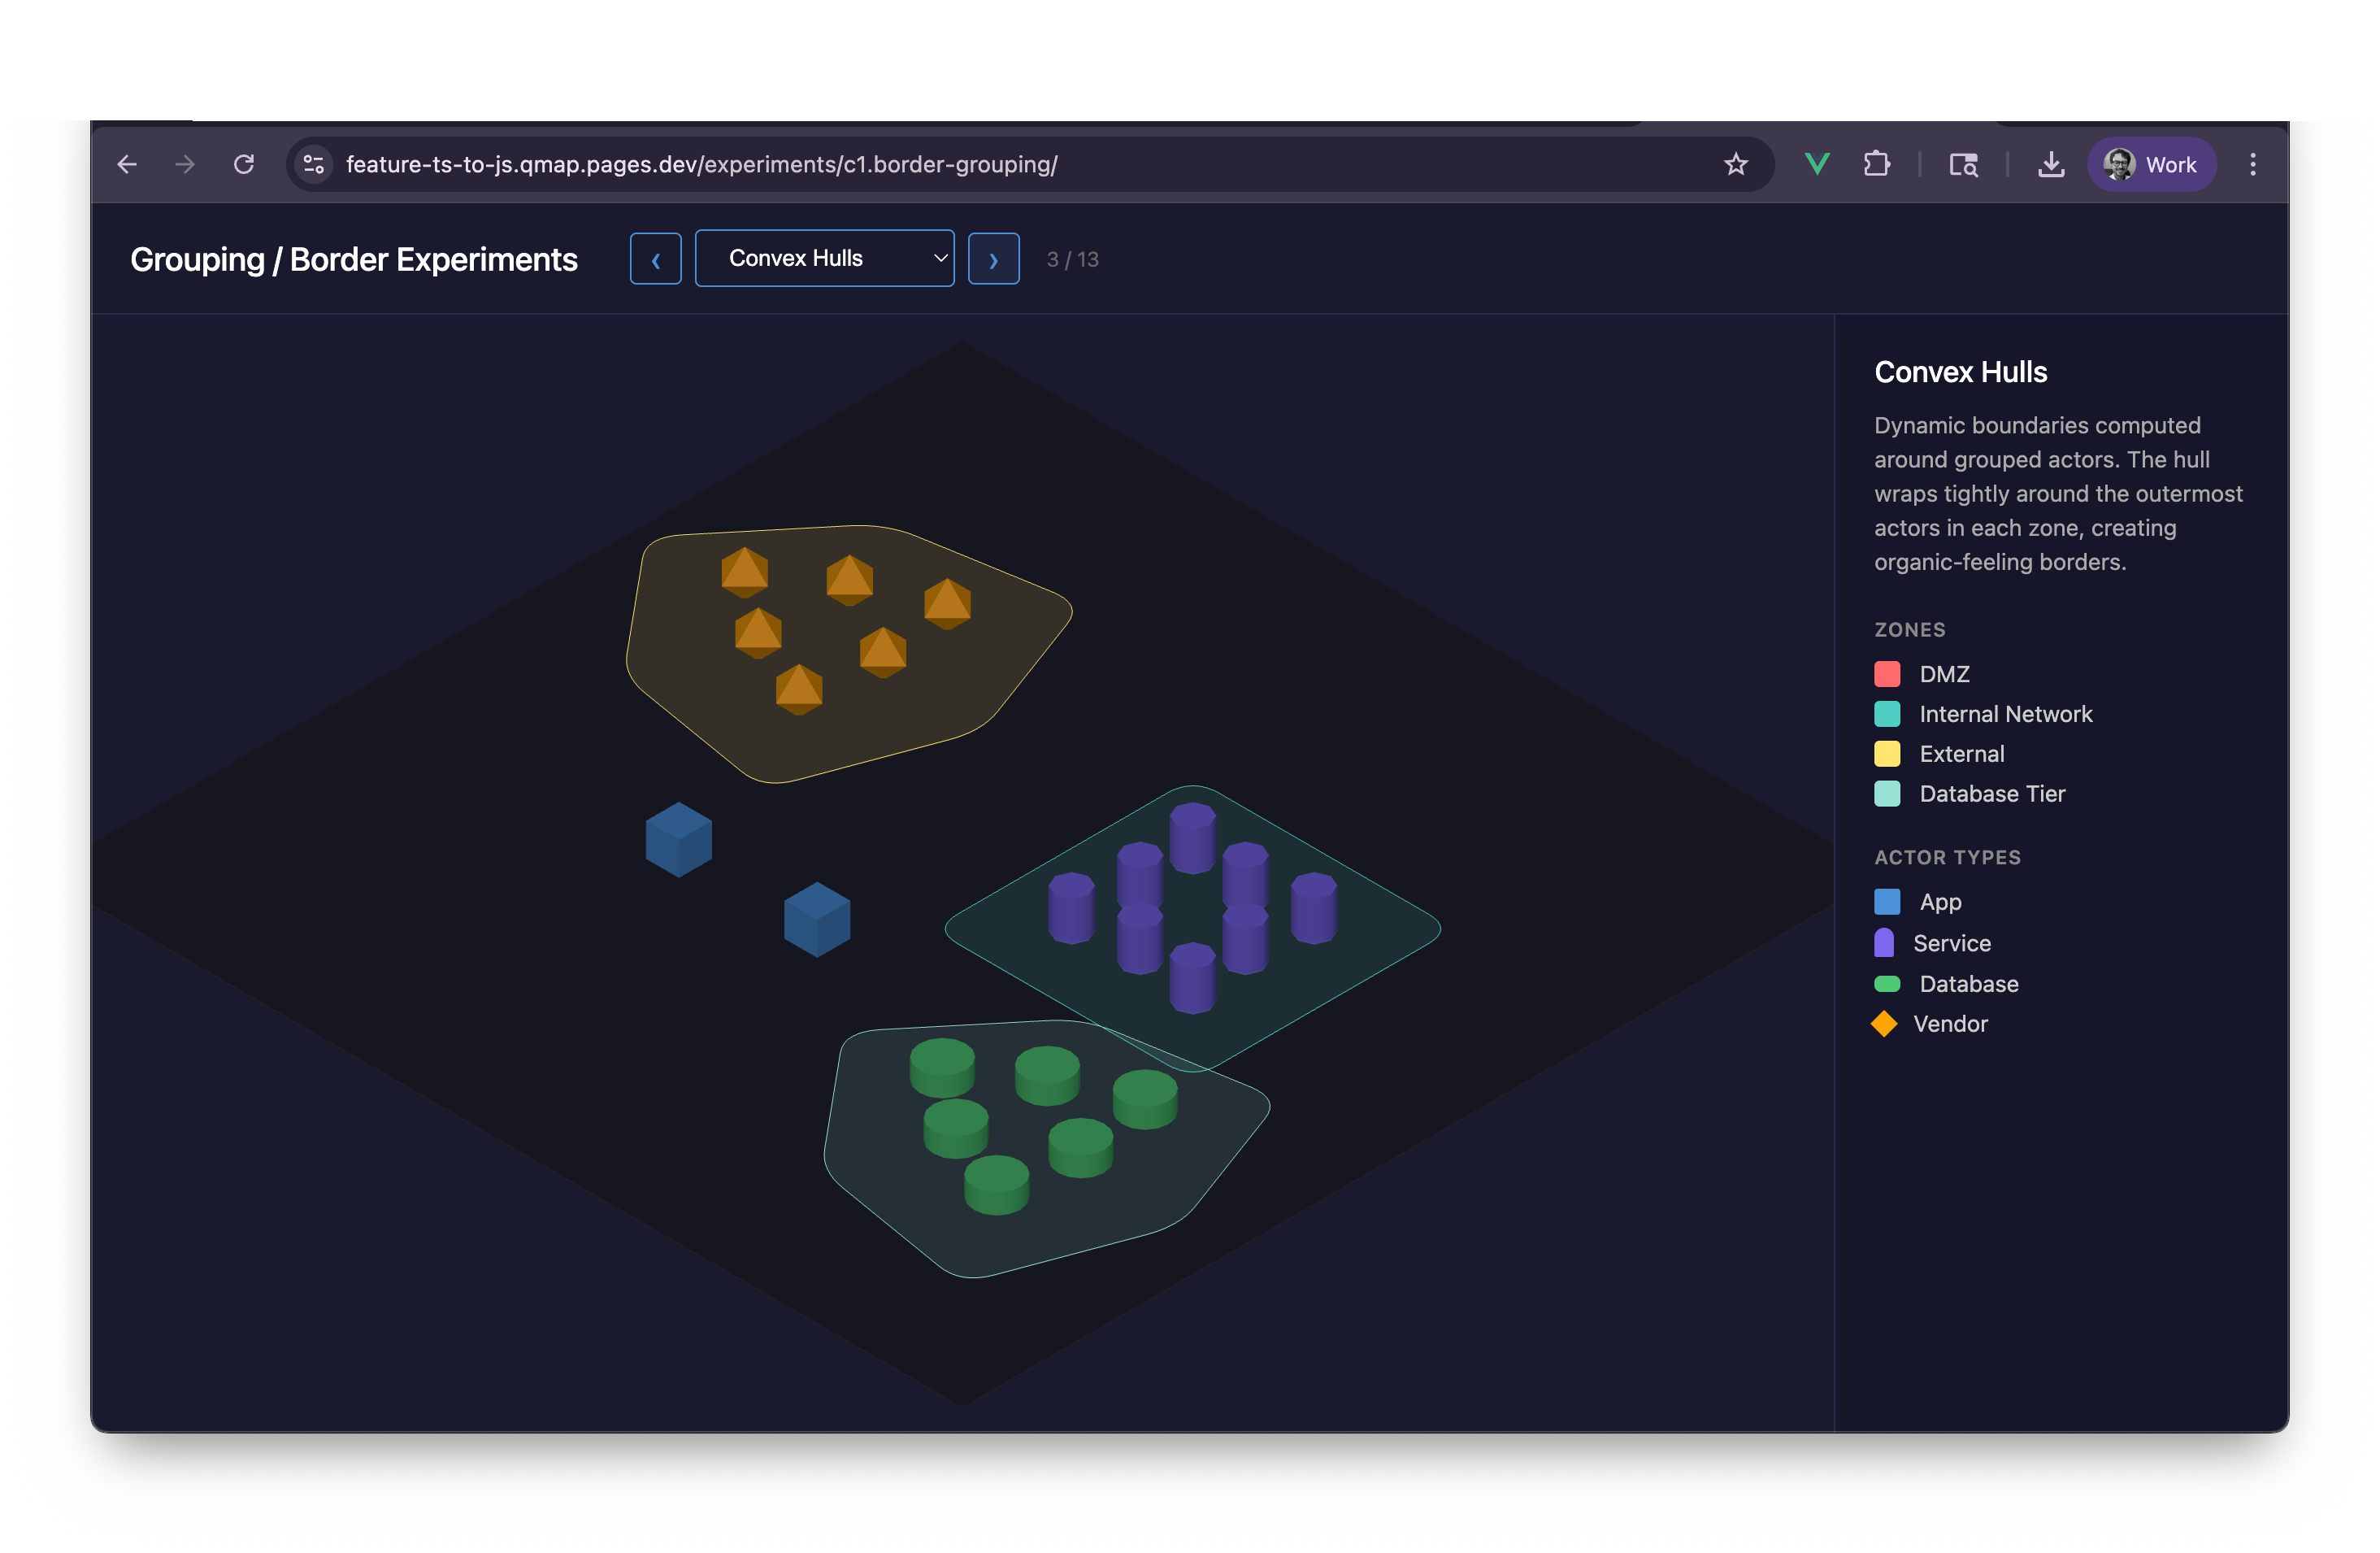
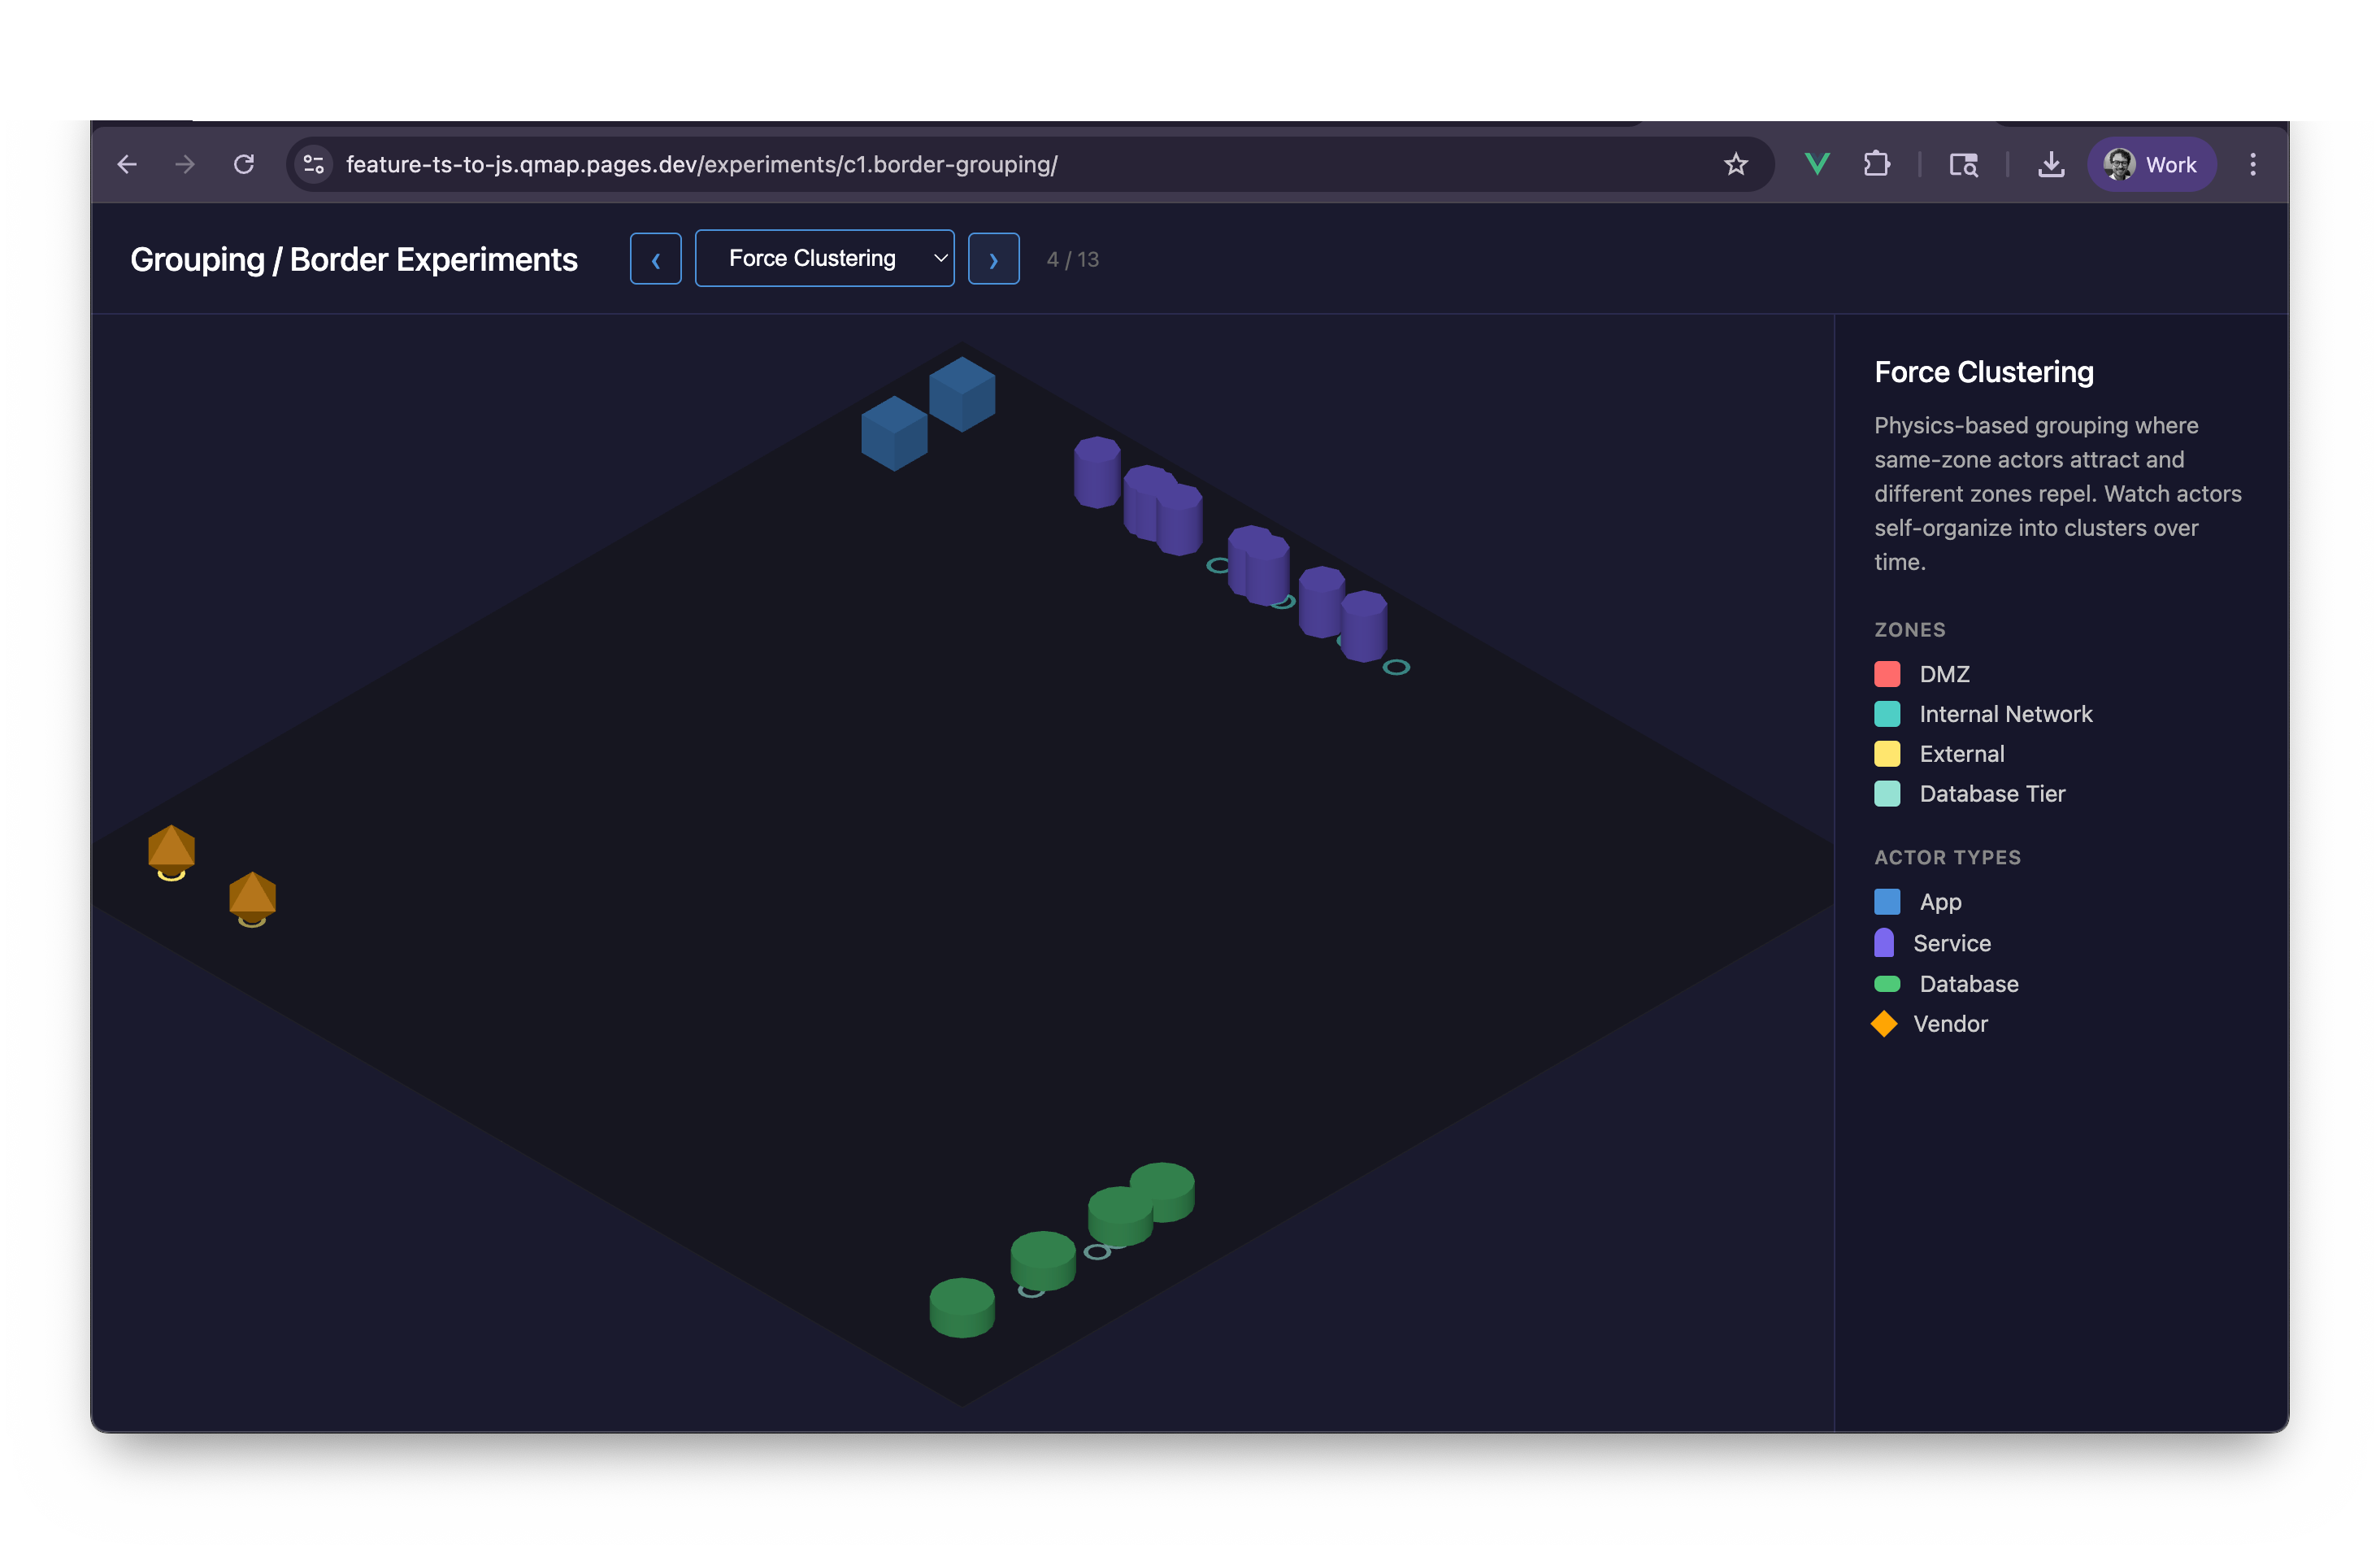
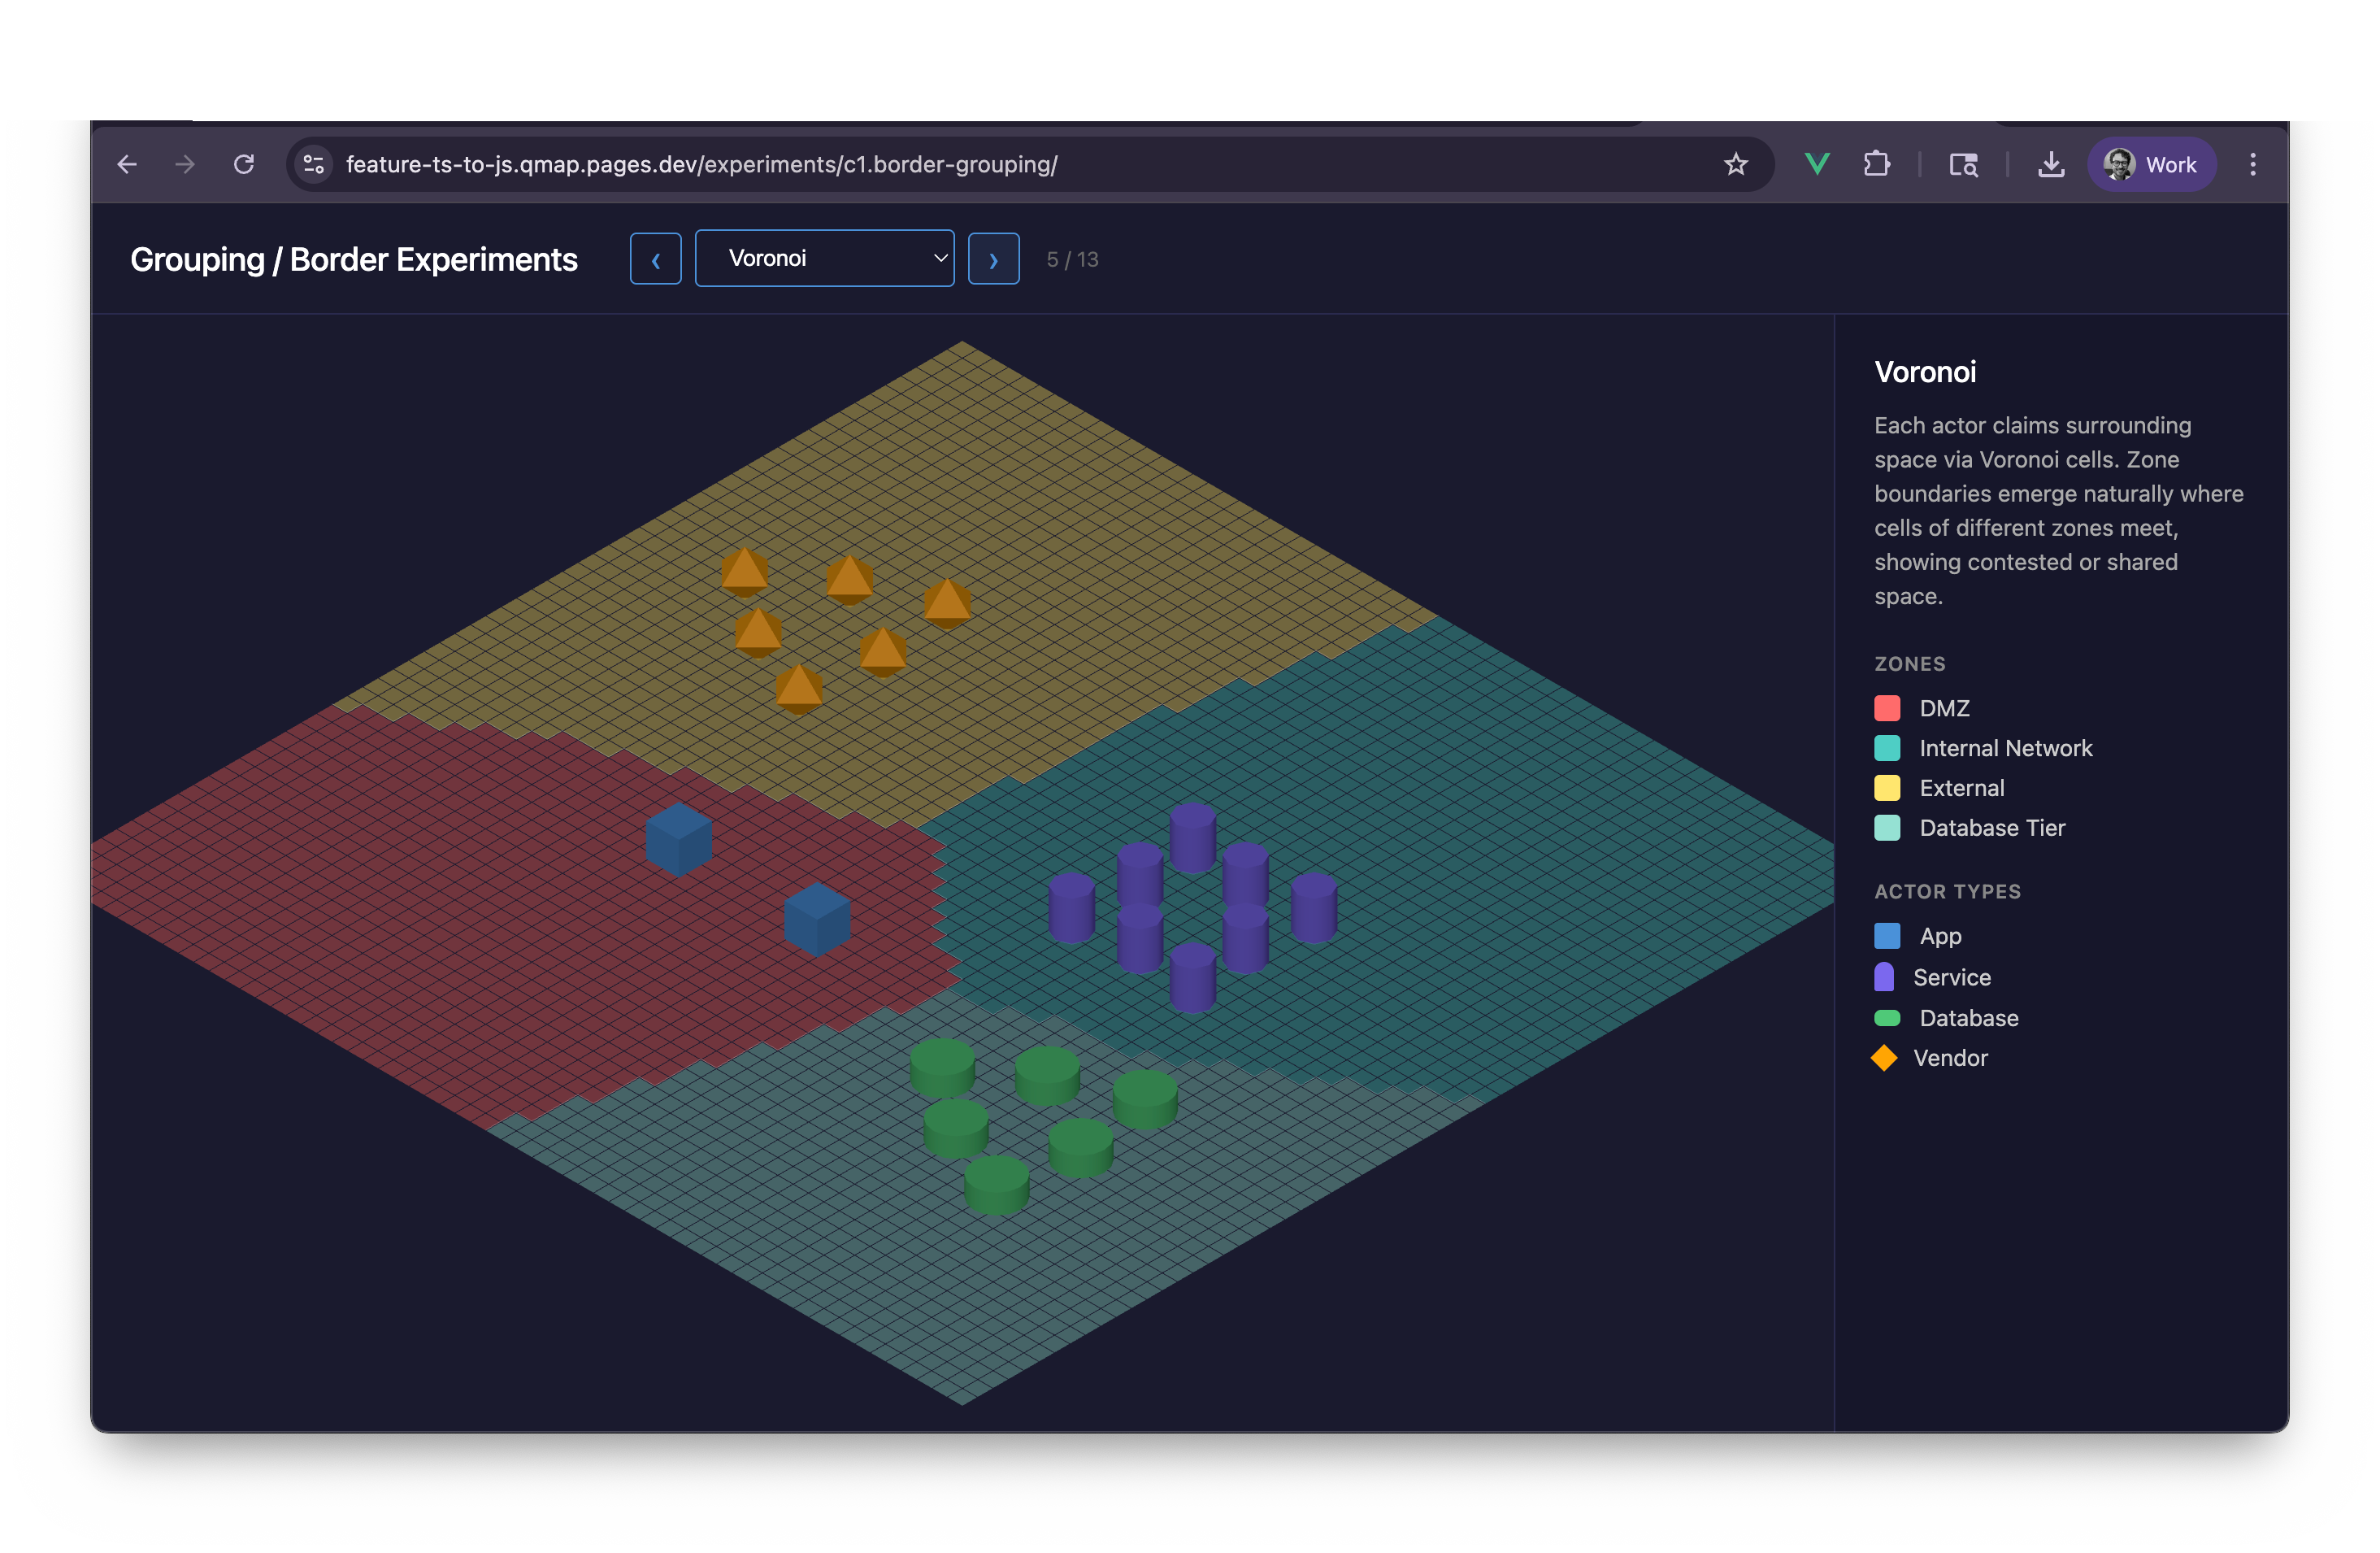
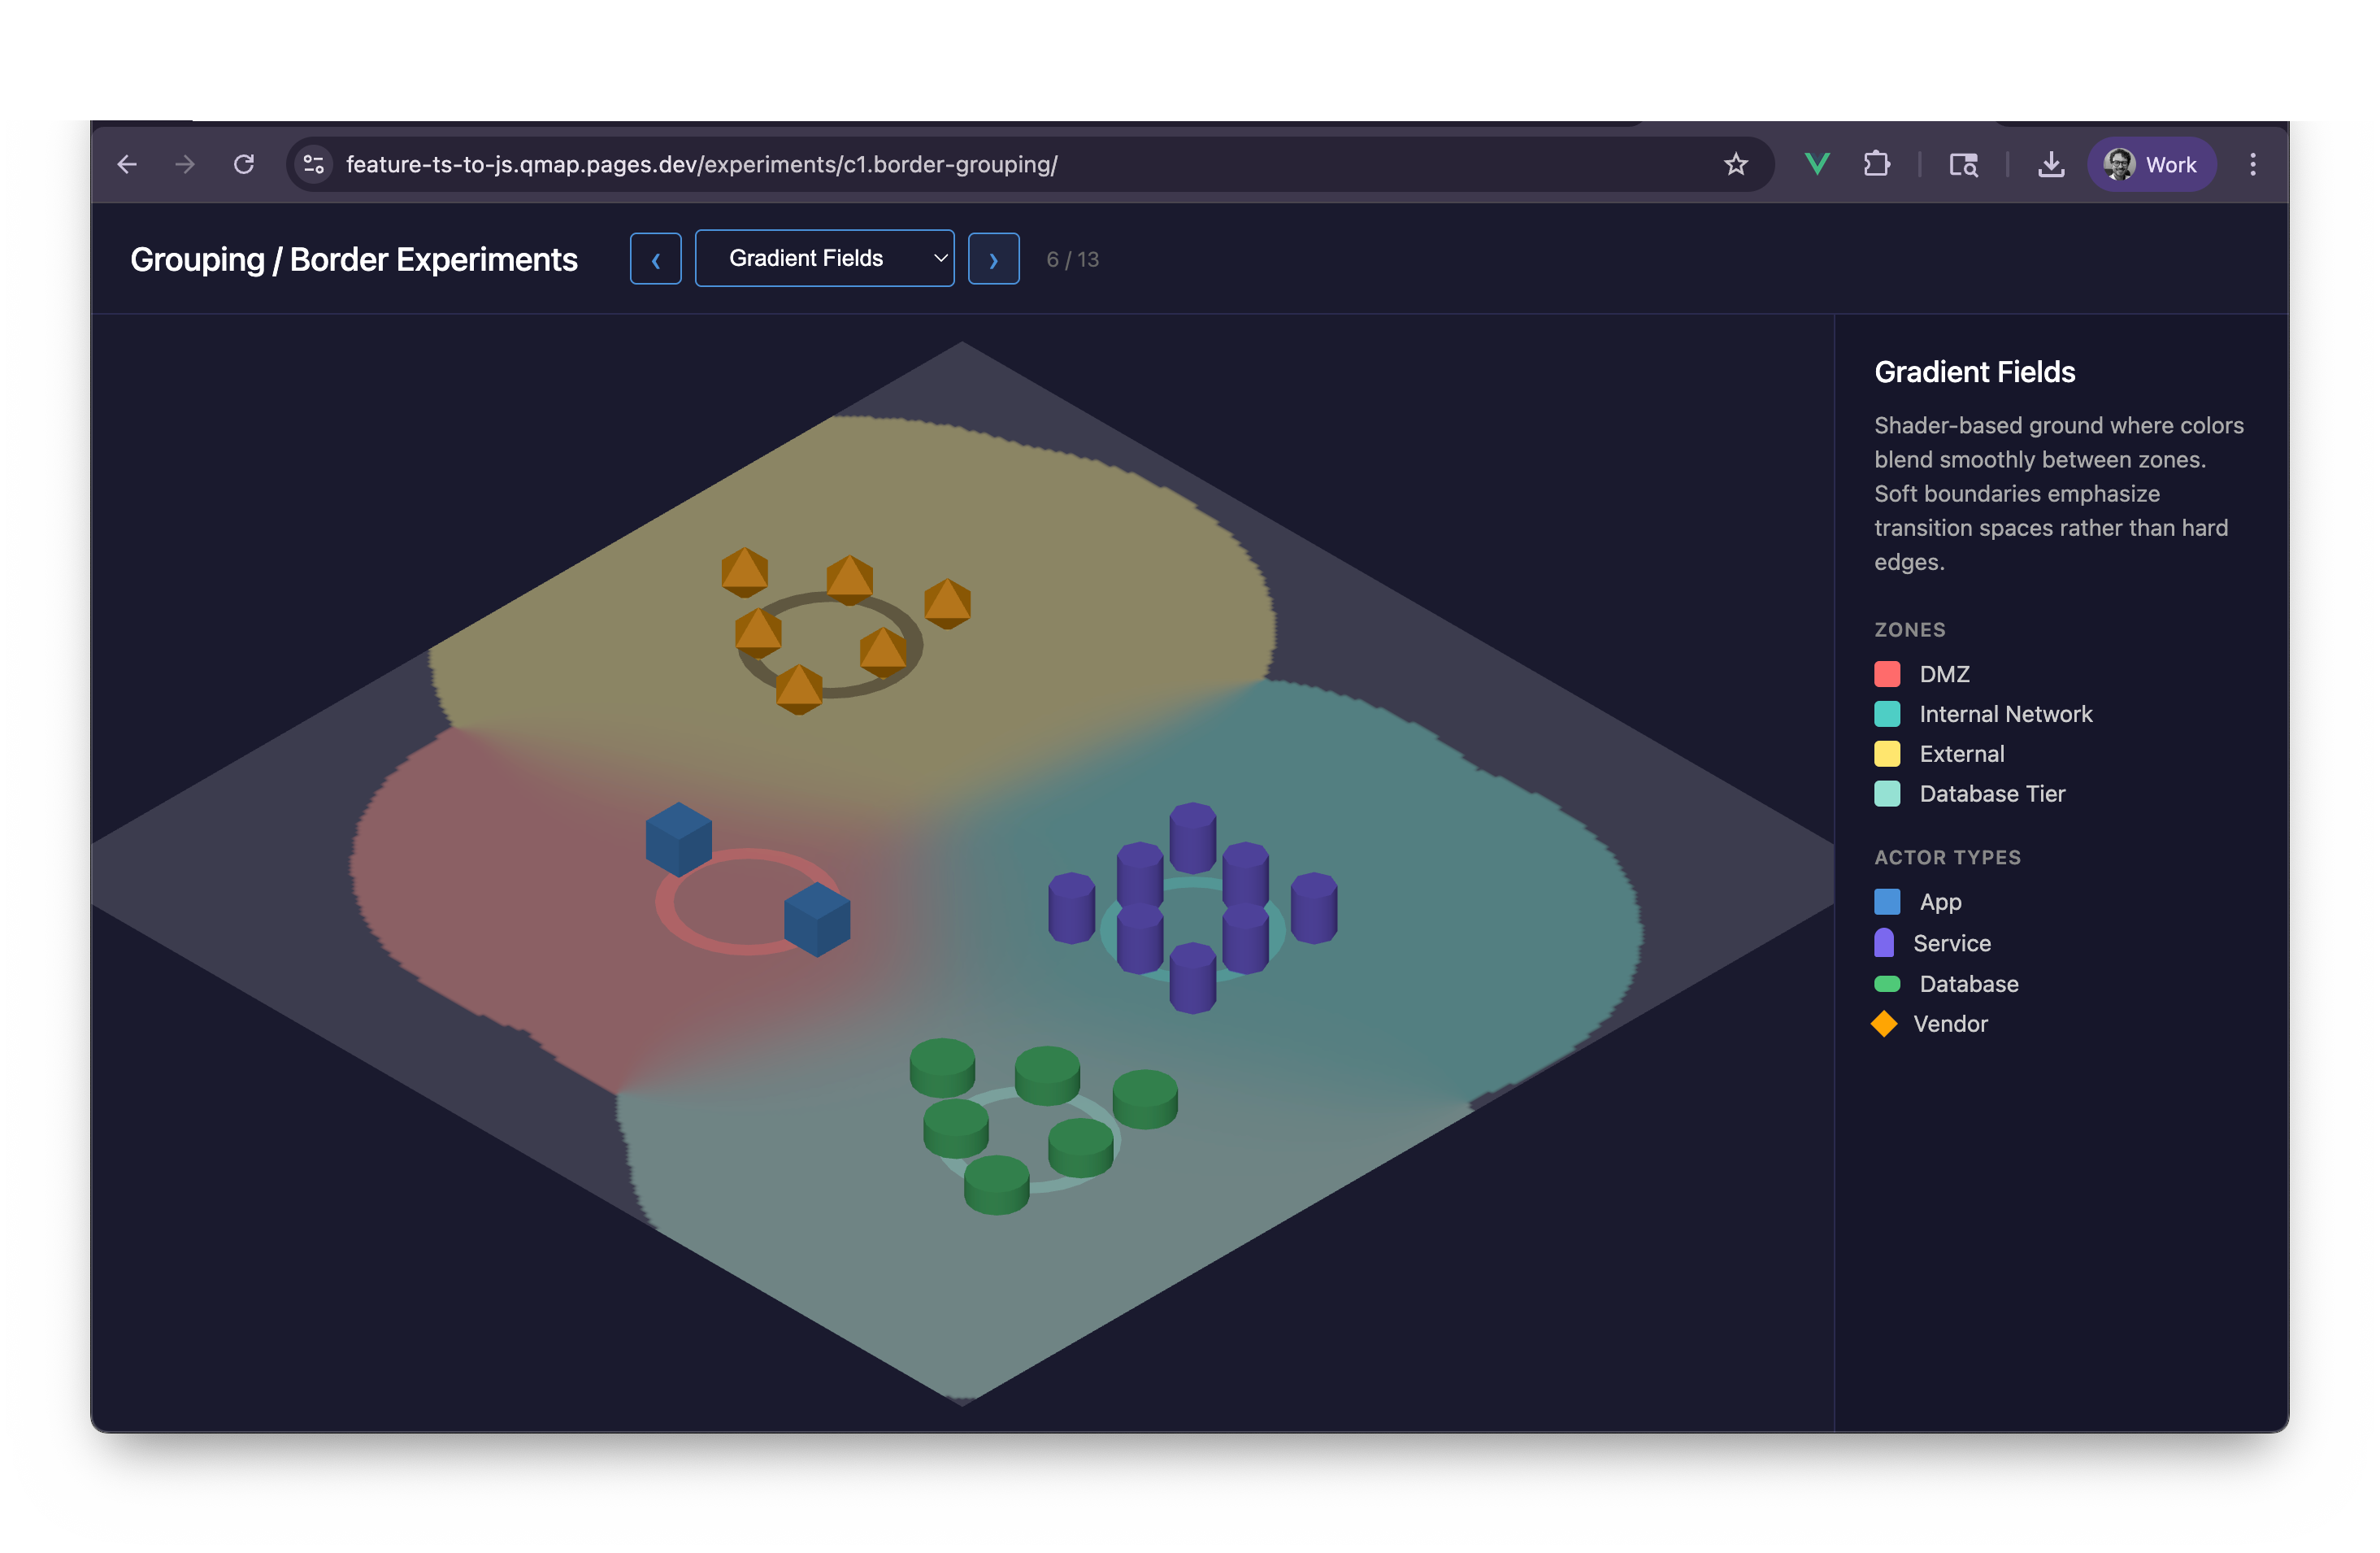
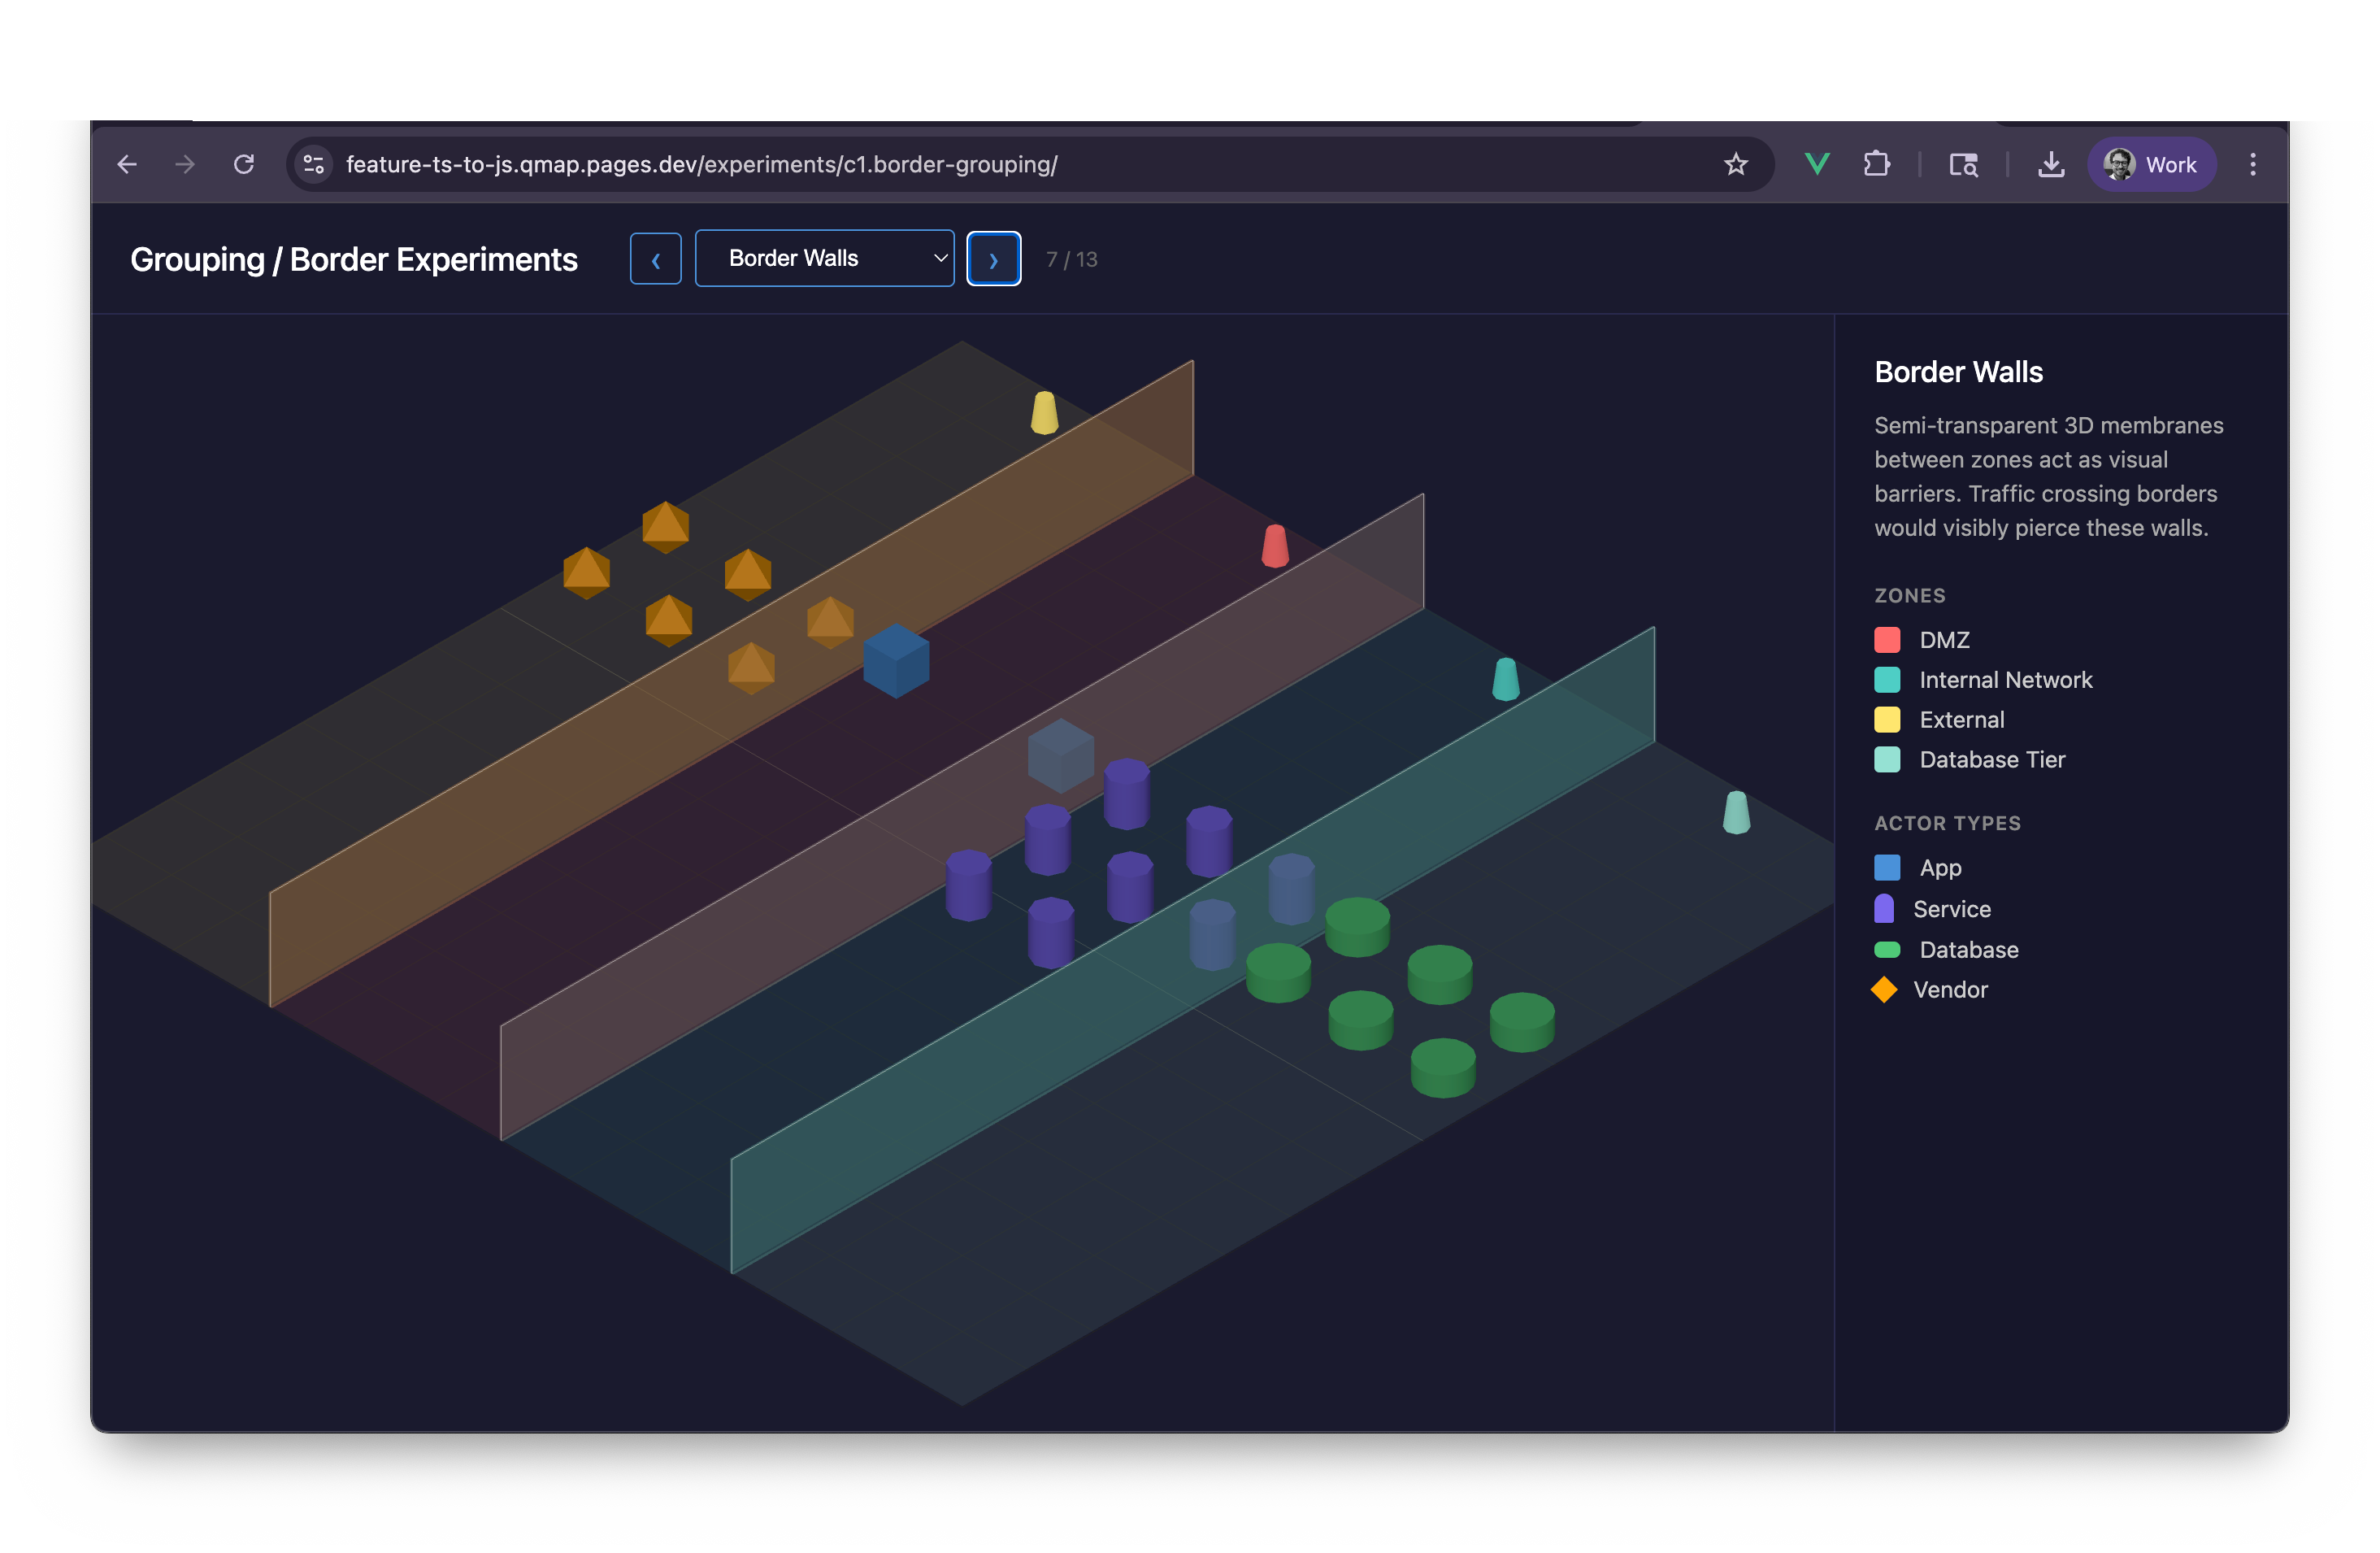
Zone Coloring — tint as boundary Layered Planes Convex Hulls wrapping each zone Force Clustering — physics settling into groups Voronoi cell boundaries Gradient Fields — soft ownership Border Walls — hard fences Zone Fog — atmosphere as territory Terrain — zones as landforms Nested Rings — the ancestor of rugs