archivedcreated 2026-03-13· last activity 2026-08-15
Live traffic — dynamic node discovery, activity-based sizing, streaming data
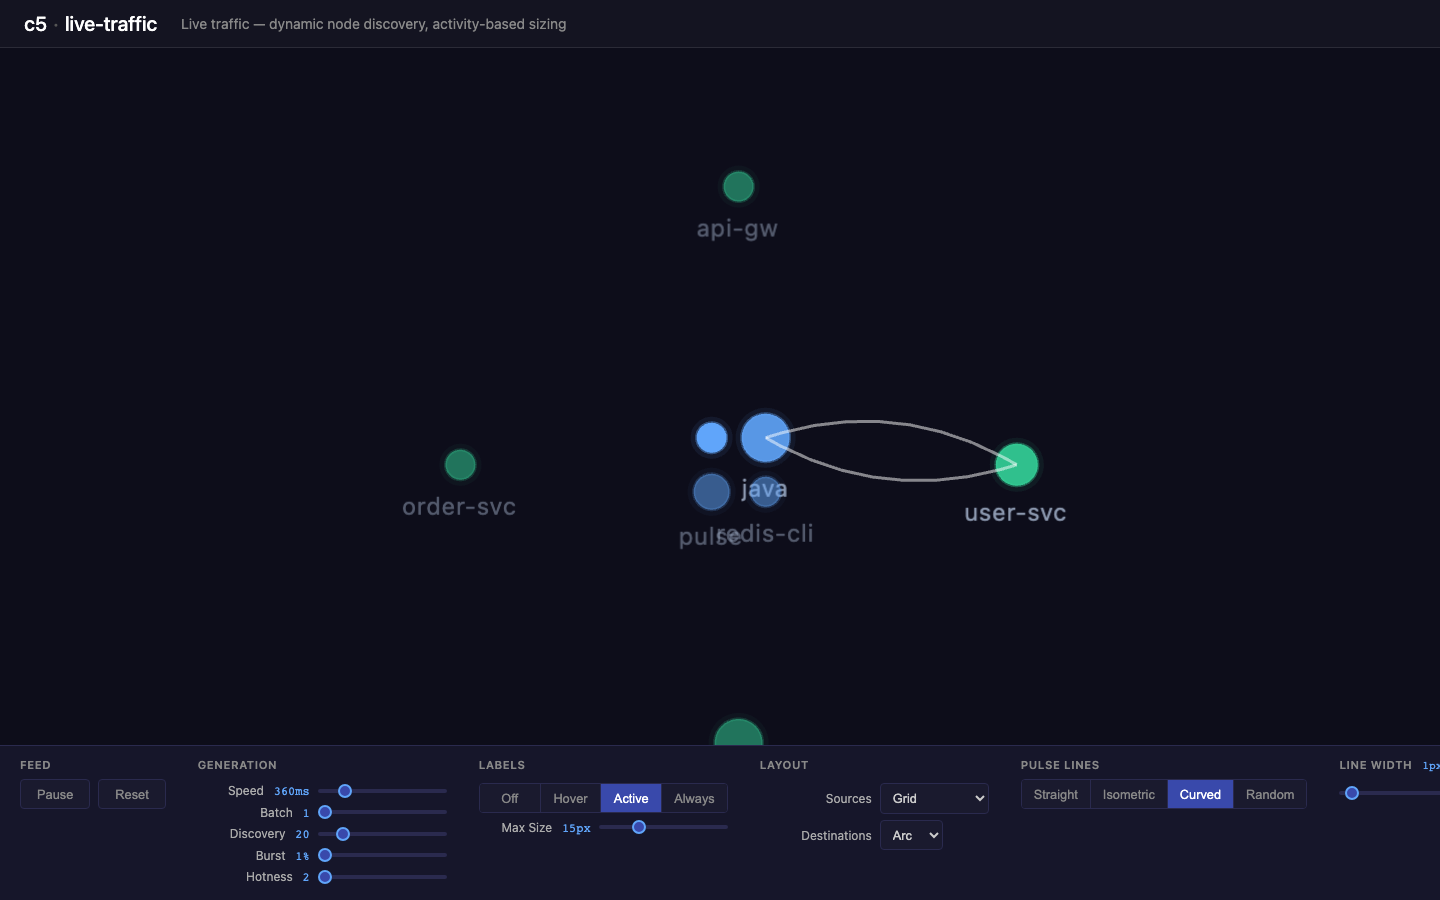
New in this cycle: Live traffic — dynamic node discovery, activity-based sizing
Initial Prompt
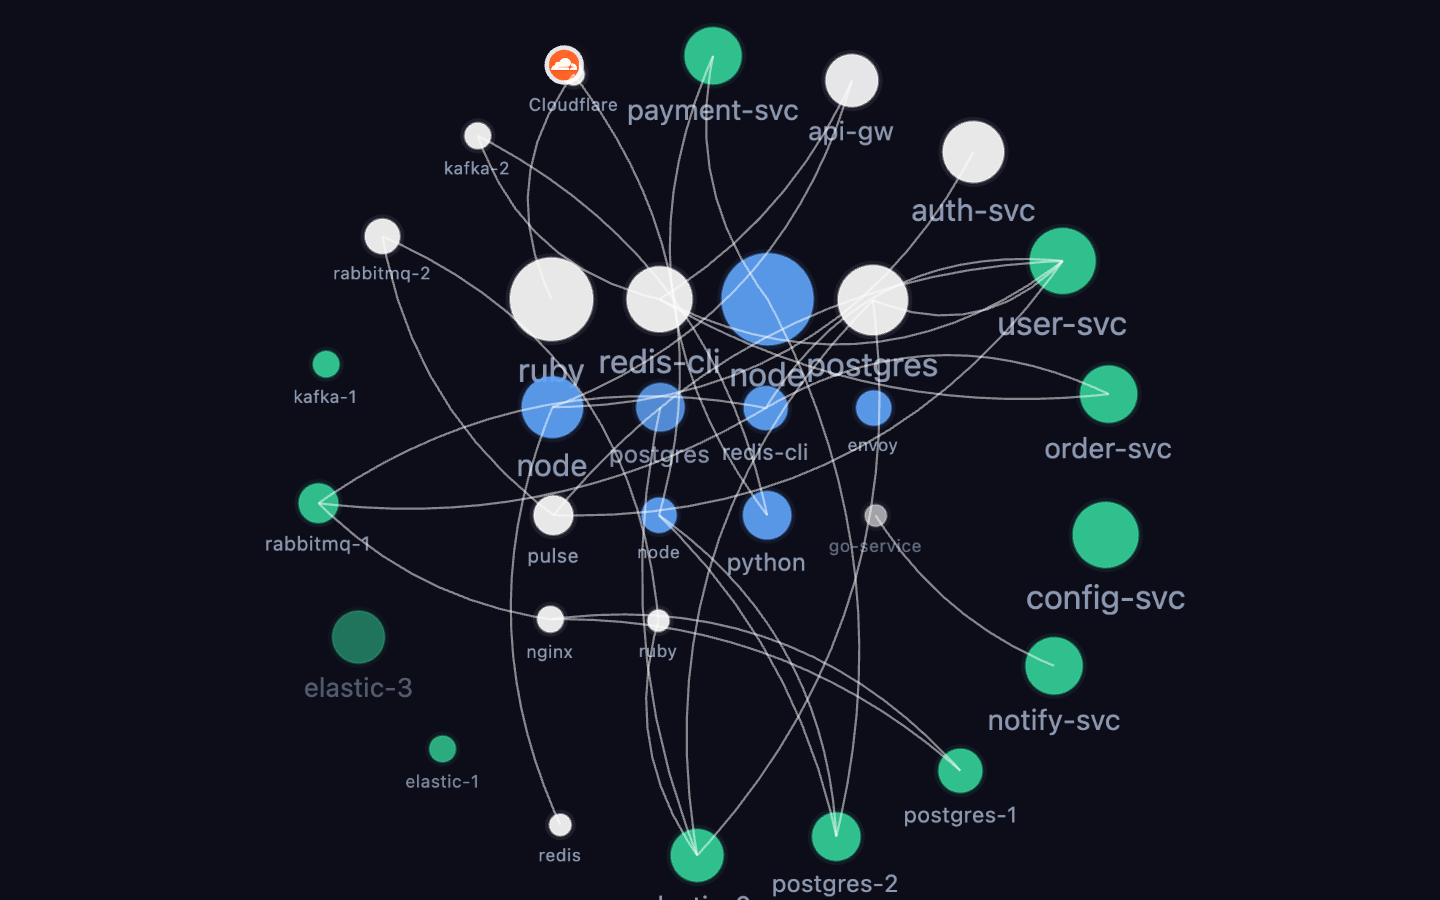
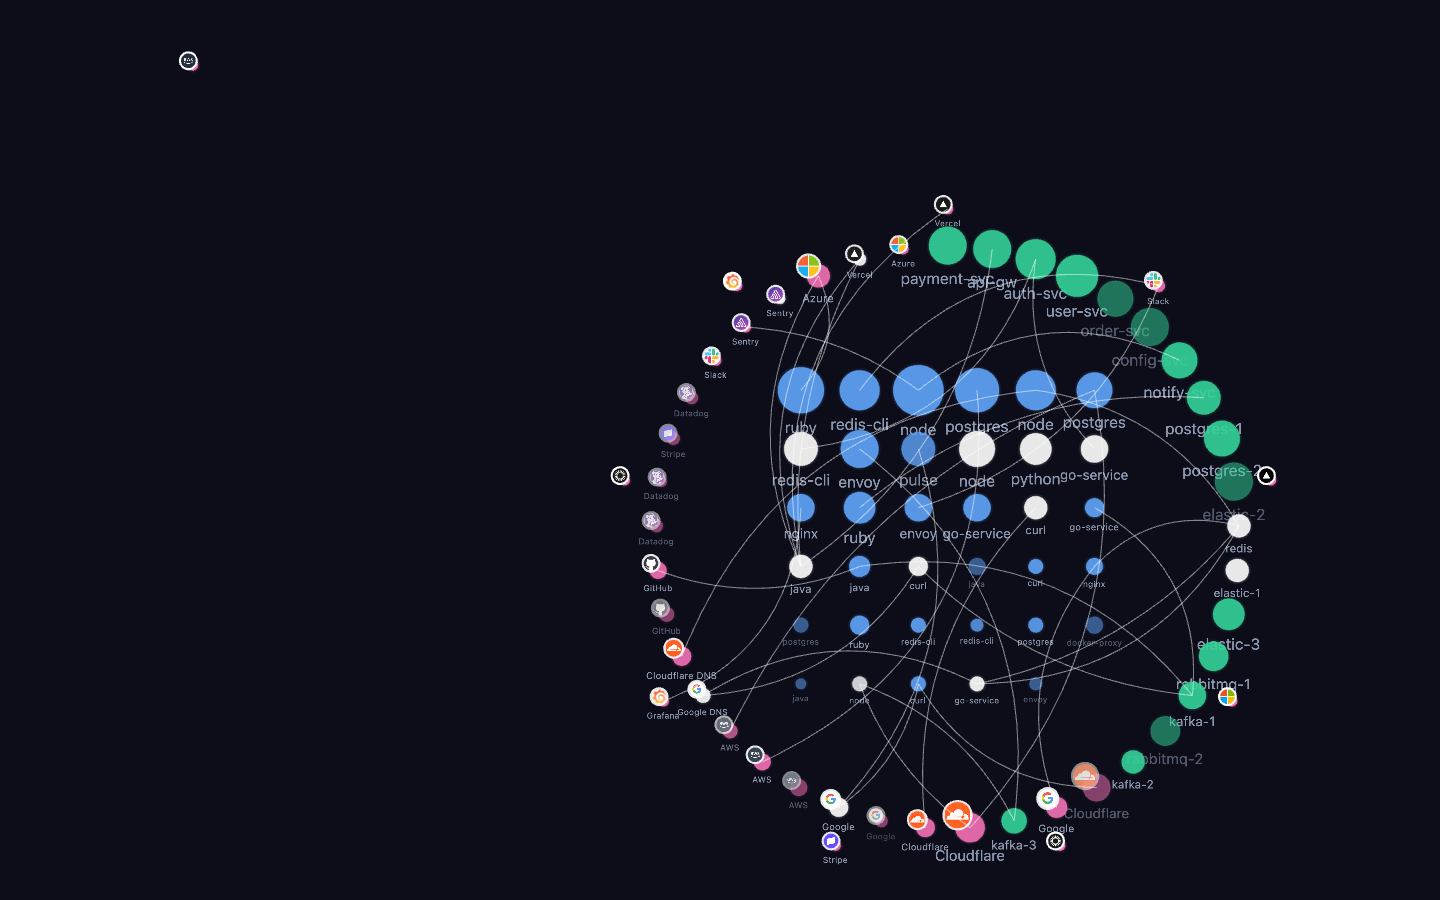
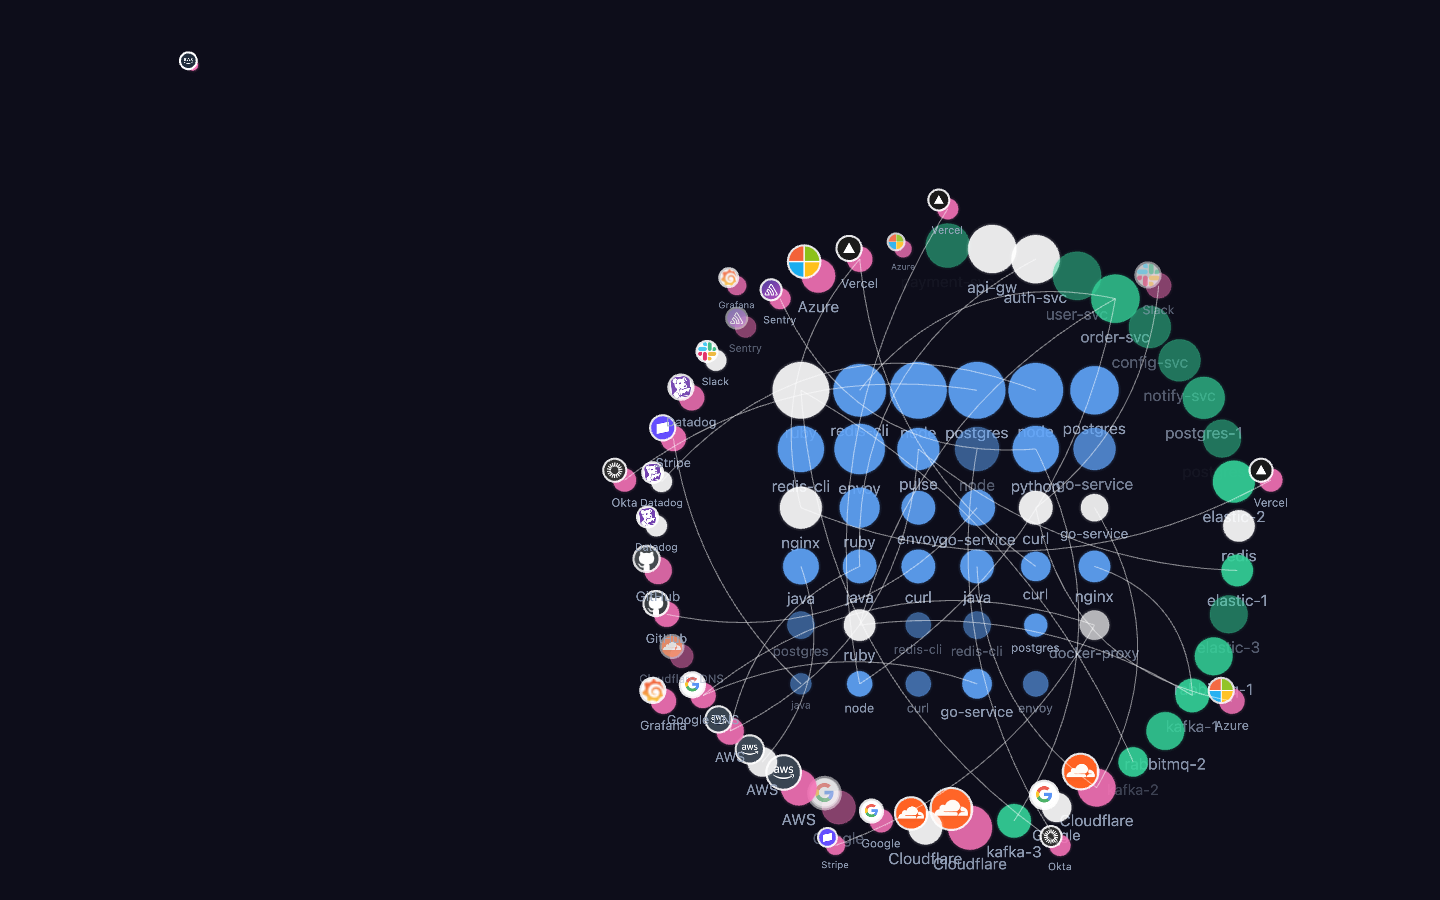
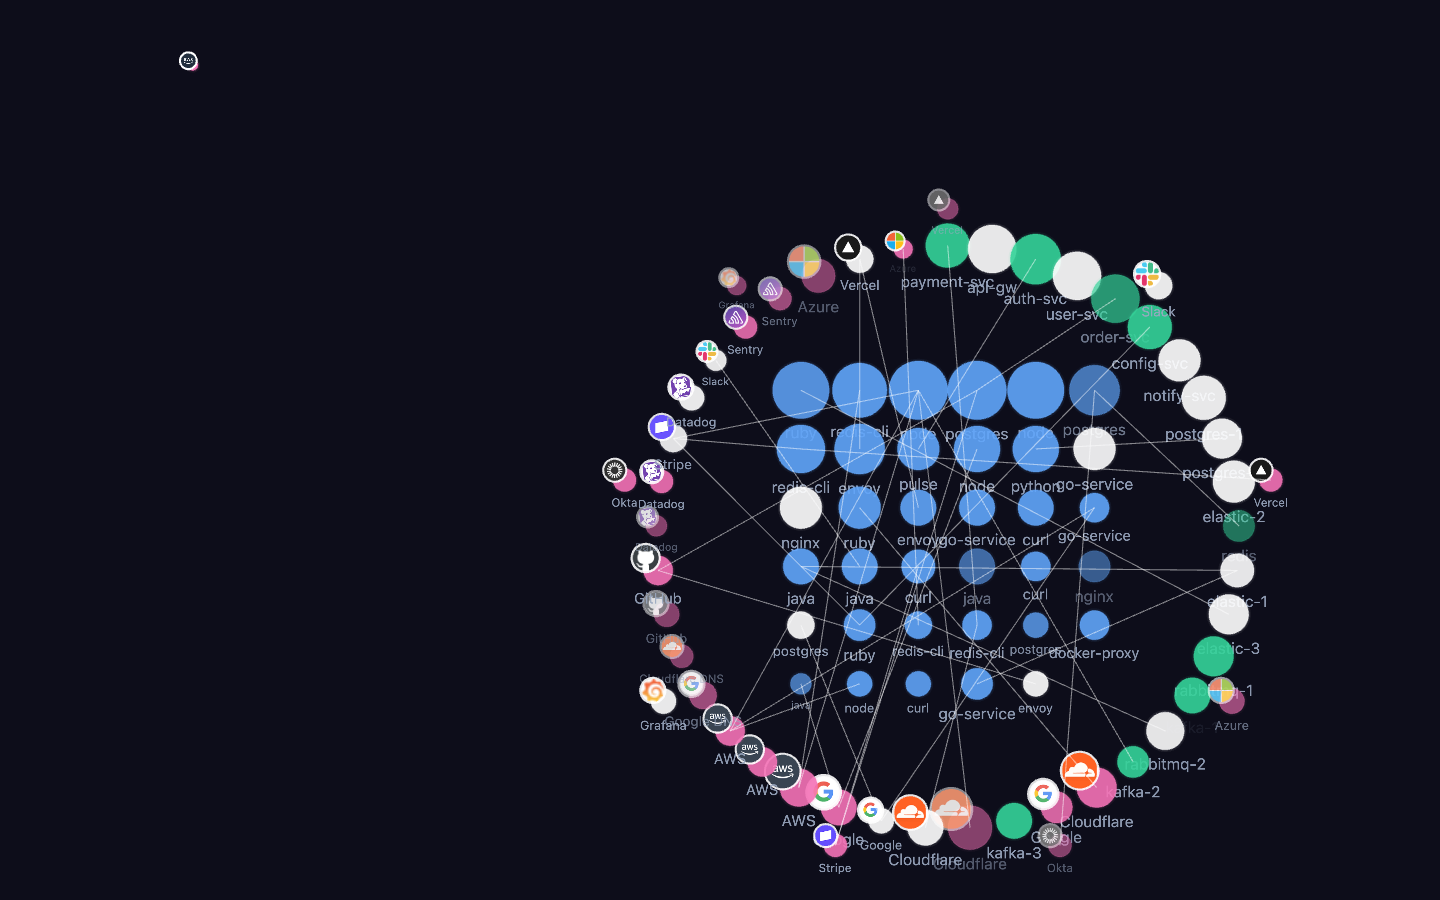
Visualize live traffic where sources and destinations are fluid — they come and go. Nodes appear dynamically as new IPs arrive in the traffic stream, grow with activity (sqrt(totalRequests) * 2.5), and label fontSize scales with node radius (minimum 8px, scale factor 1.0x radius).
Architecture
LiveFeed — data ingestion layer wrapping a traffic generator, emits batches on a configurable timer with ±50% jitter
NodeRegistry — tracks per-source/destination request counts and last-seen timestamps for activity-based sizing
Zoom/pan — scroll-to-zoom (cursor-aware), click-drag pan with 4px dead zone
Visual record
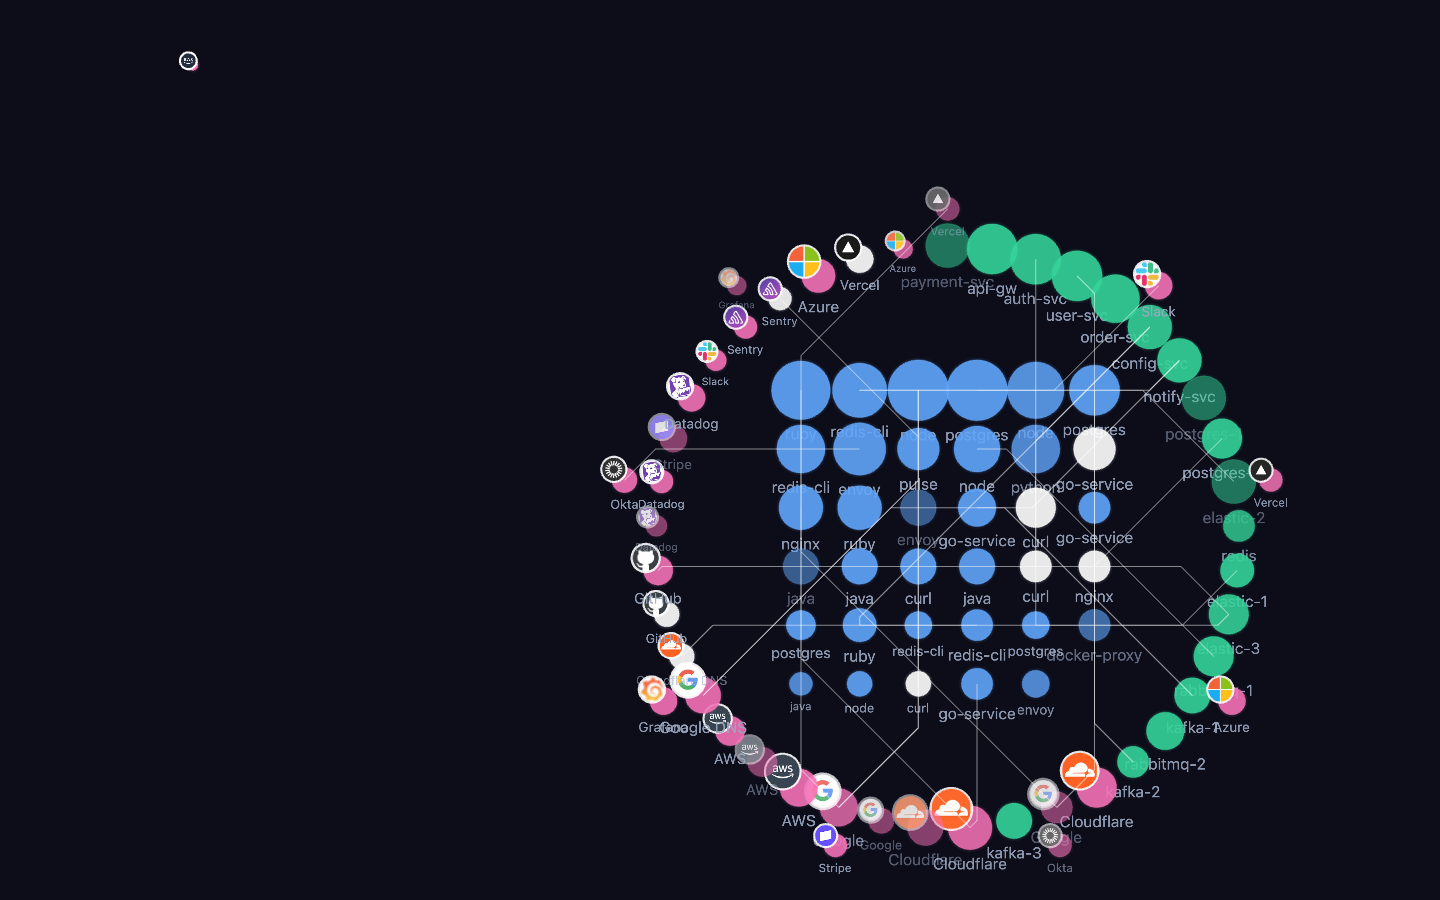
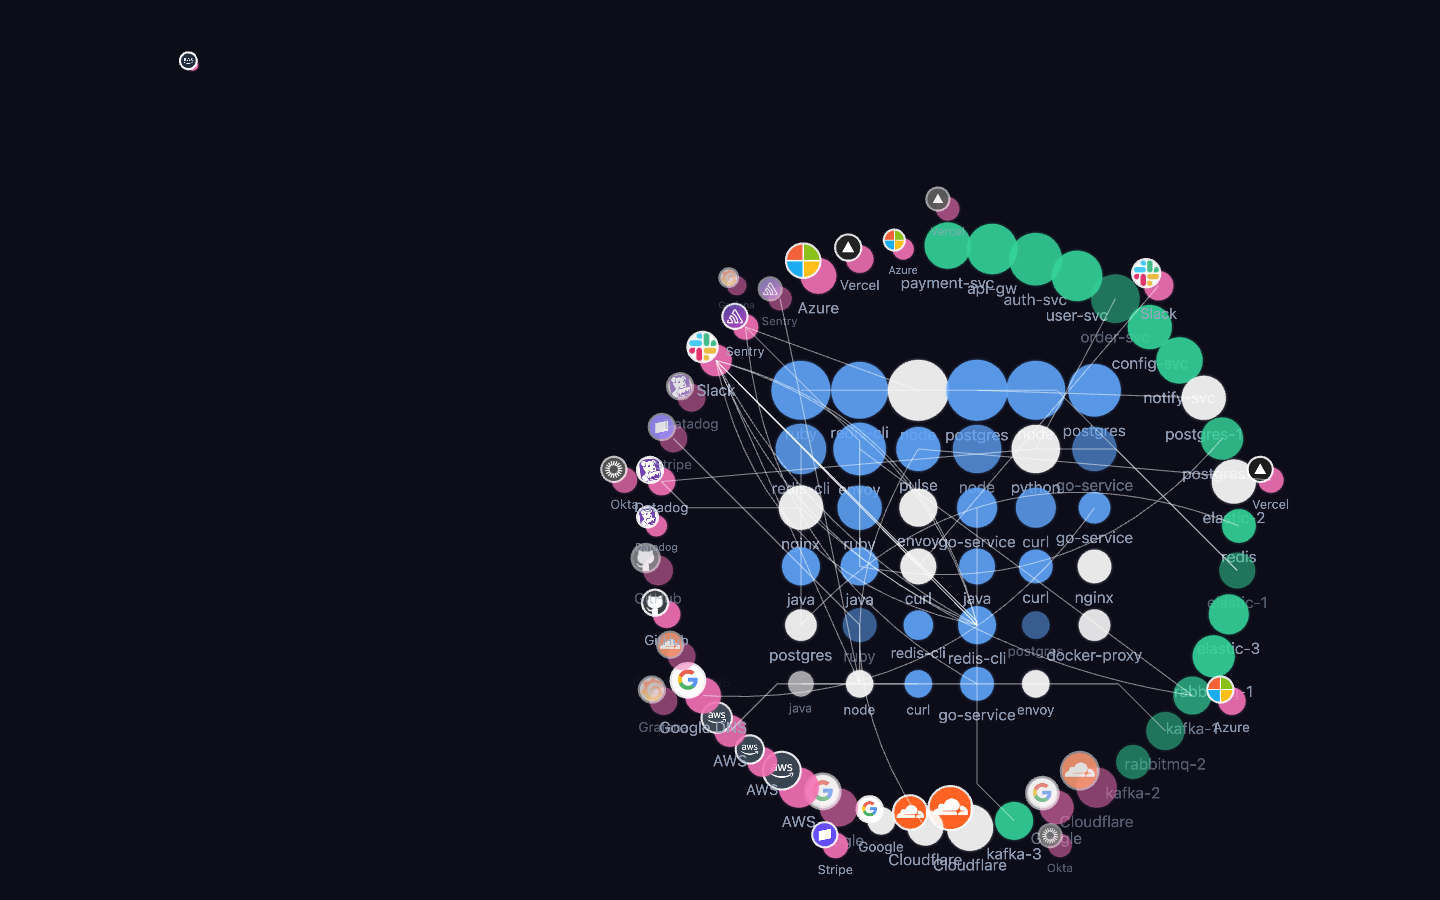
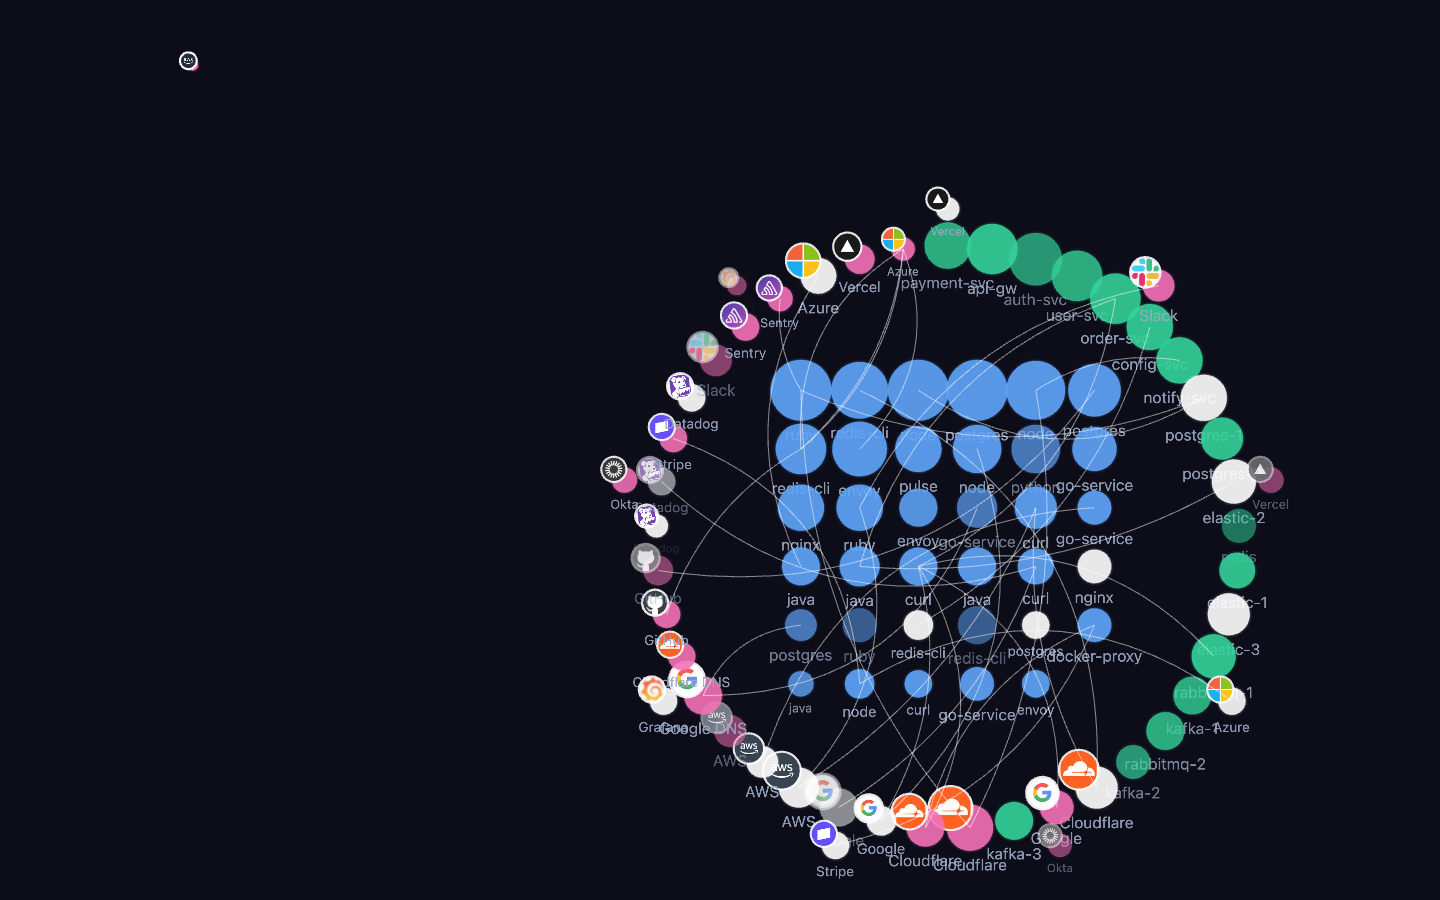
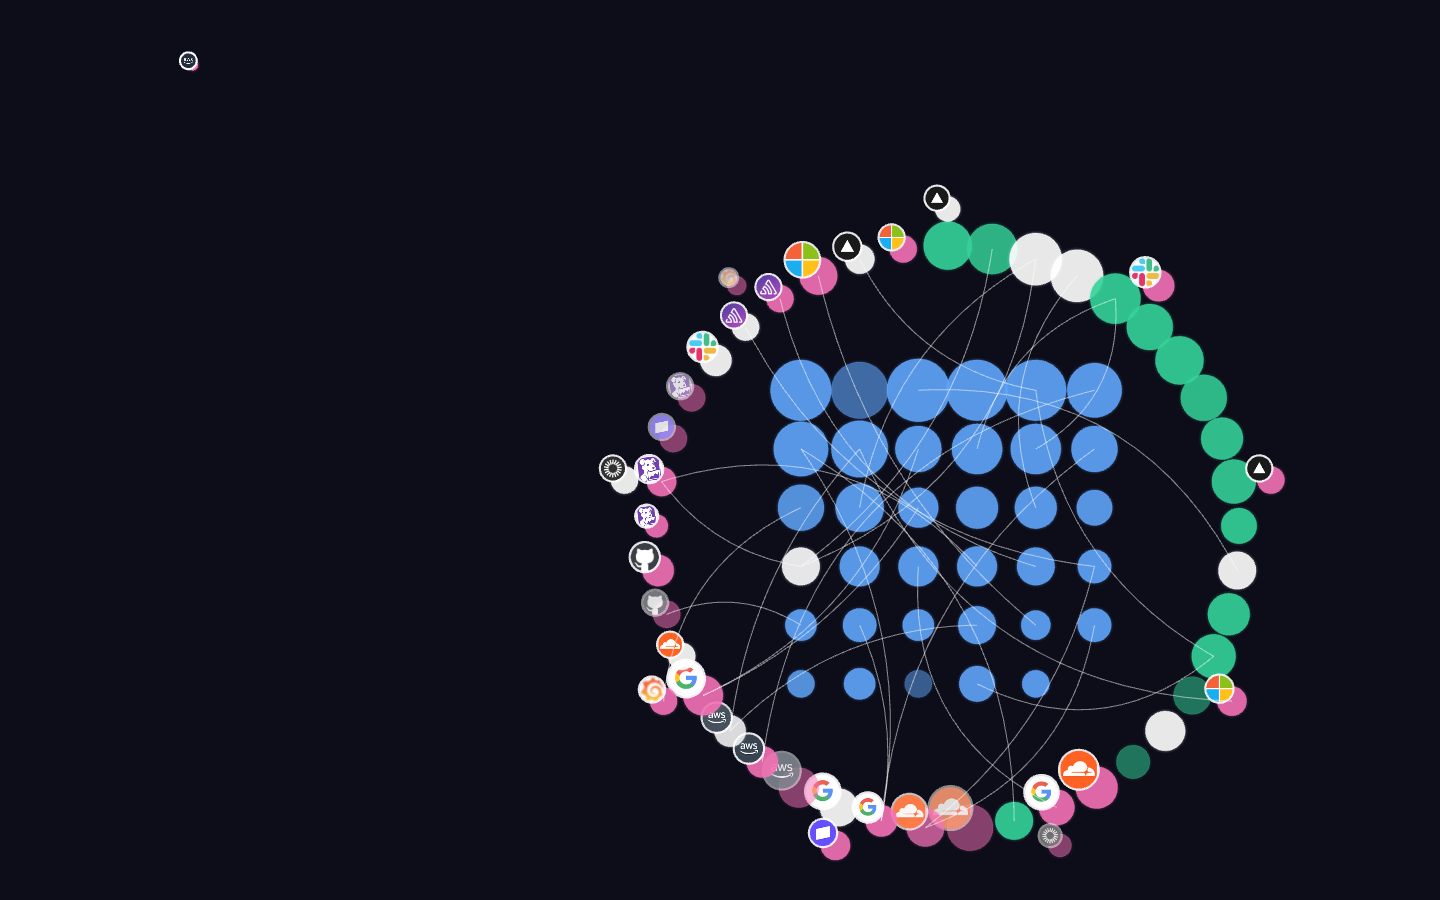
9 captures — heroes, page slices, and full-page renders. Click to view.
Feed cranked, ~4s in — first discoveries beyond the seed nodes ~12s — the field filling in, hot nodes growing ~27s — populated field, activity sizing visible Straight pulse lines Isometric pulse lines Random line mode — controlled chaos Every label on at full density Labels off — pure traffic topology