AI Ecosystem
PixiJS experiments expressing the AI agent monitoring dataset for security teams
New in this cycle: AI-agent visual language — session graphs, infra map, capability surface, inventory
Why
Driven by design cycle c33 (ai-ecosystem-visualizations). The AI monitoring dataset Qpoint captures — sessions, users, agents, endpoints, models, API keys, tools, files, secondary network calls — was expressed only as tables and list views. qflow's spatial, animated idiom was a candidate medium for making that data legible to security teams. This cycle is the qflow half of that exploration: a set of canvas experiments, each answering a distinct security question spatially, without committing to production-bound designs.
Objective
Build visual experiments over the AI session/inventory data as a test fixture, versioned as Exp{Name}.r{N}.vue and switchable from a shared nav shell (App.vue):
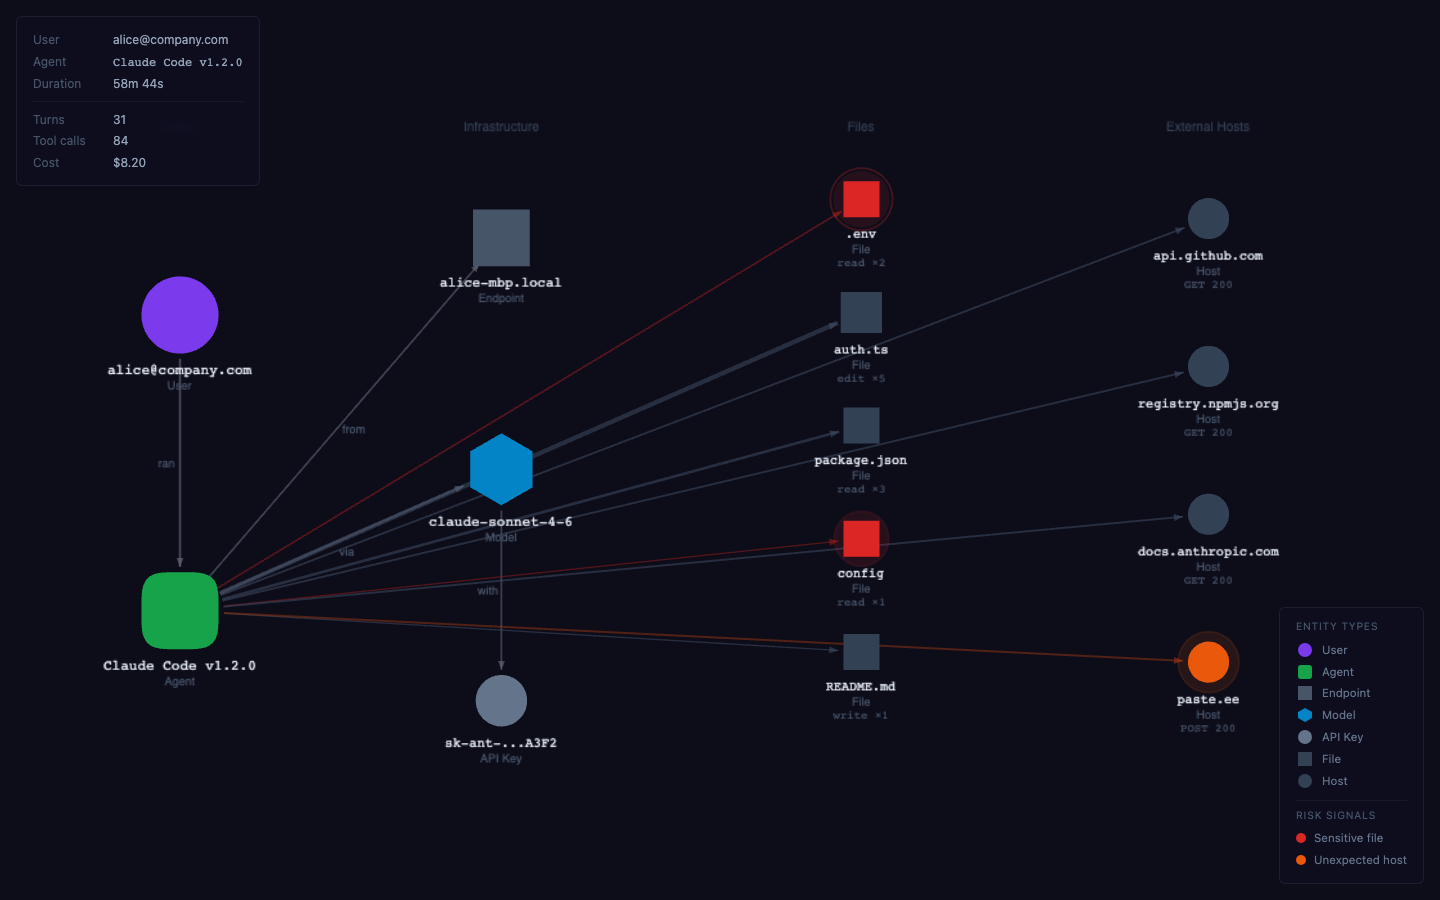
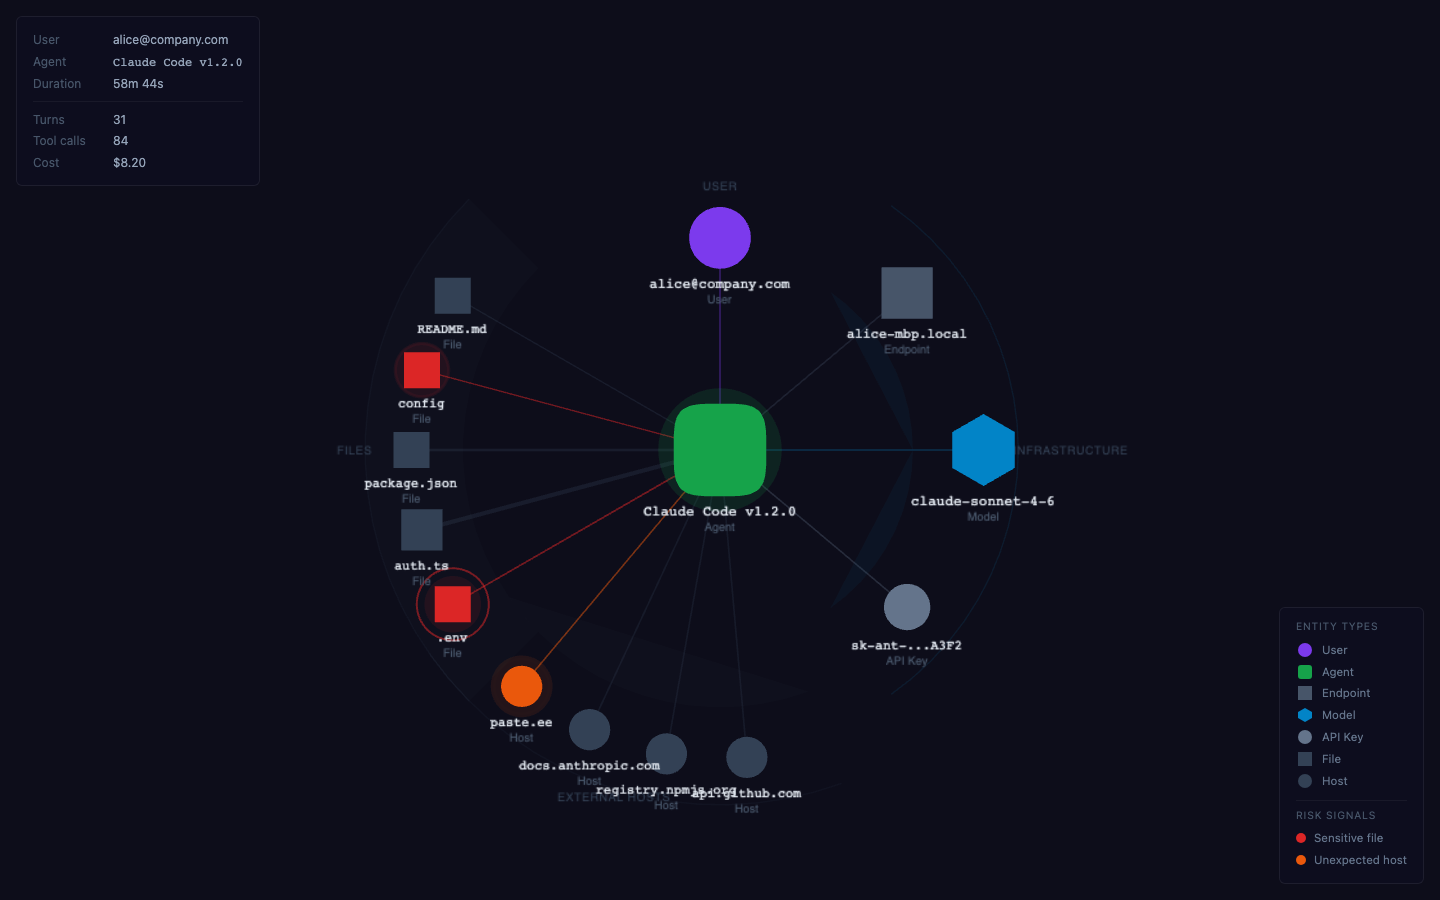
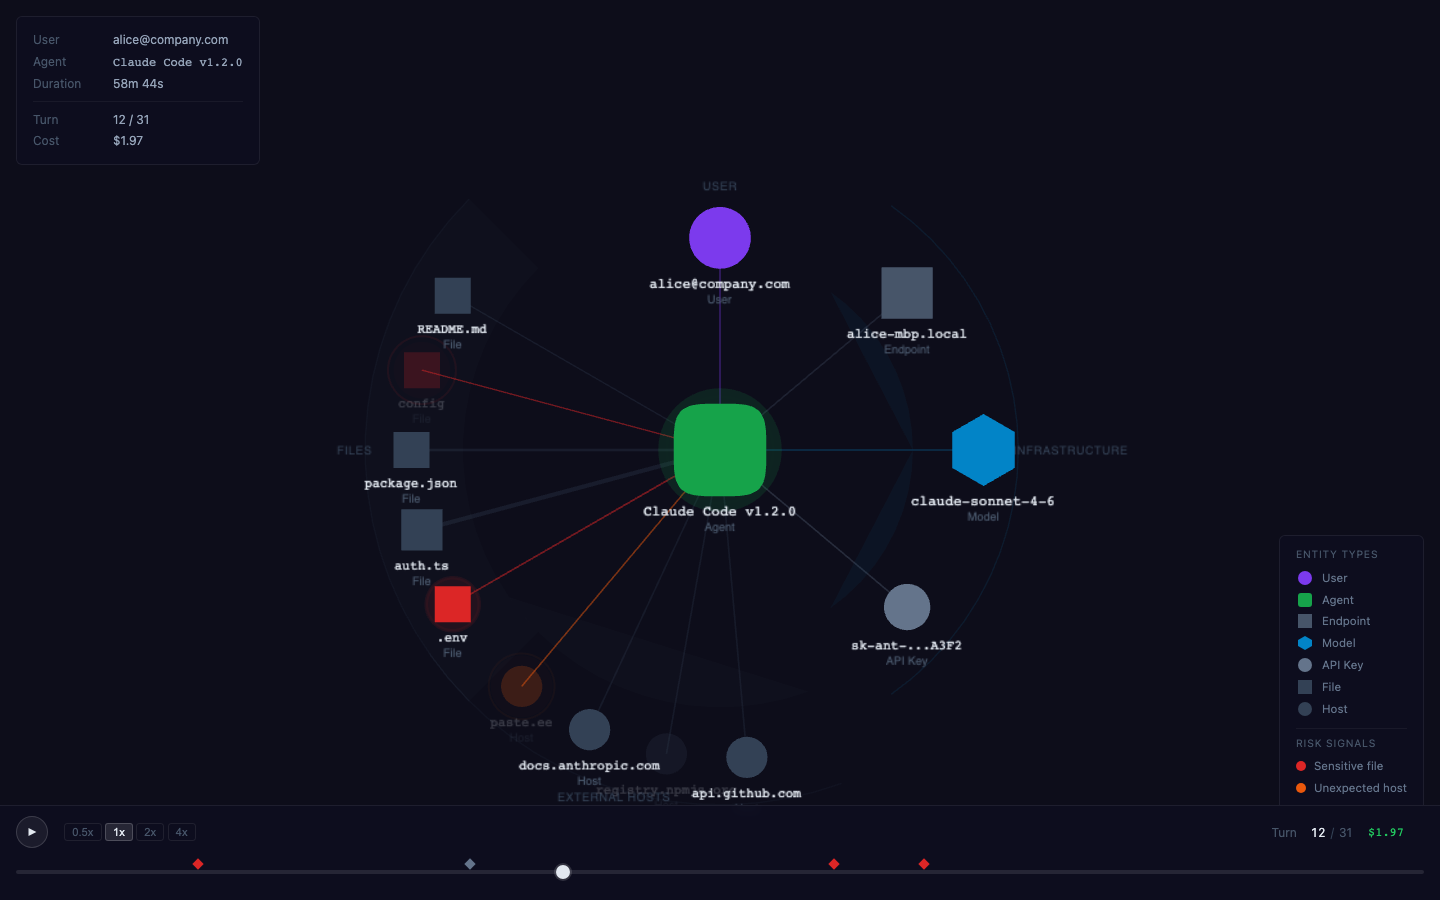
- Session Graph — "What did this agent touch?"
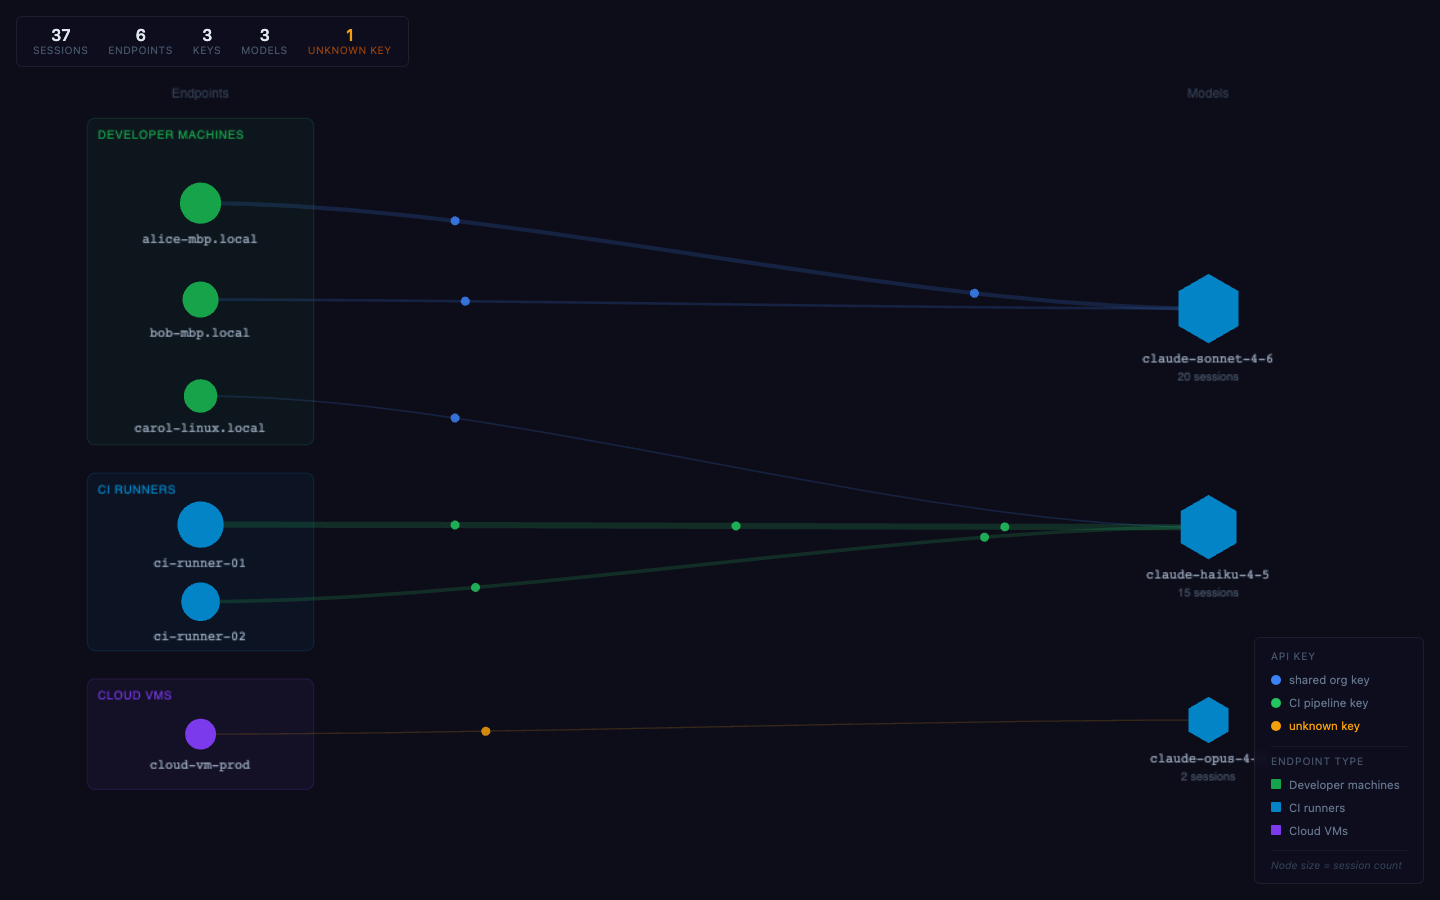
- Infrastructure Map — "Who is connected to what, org-wide?"
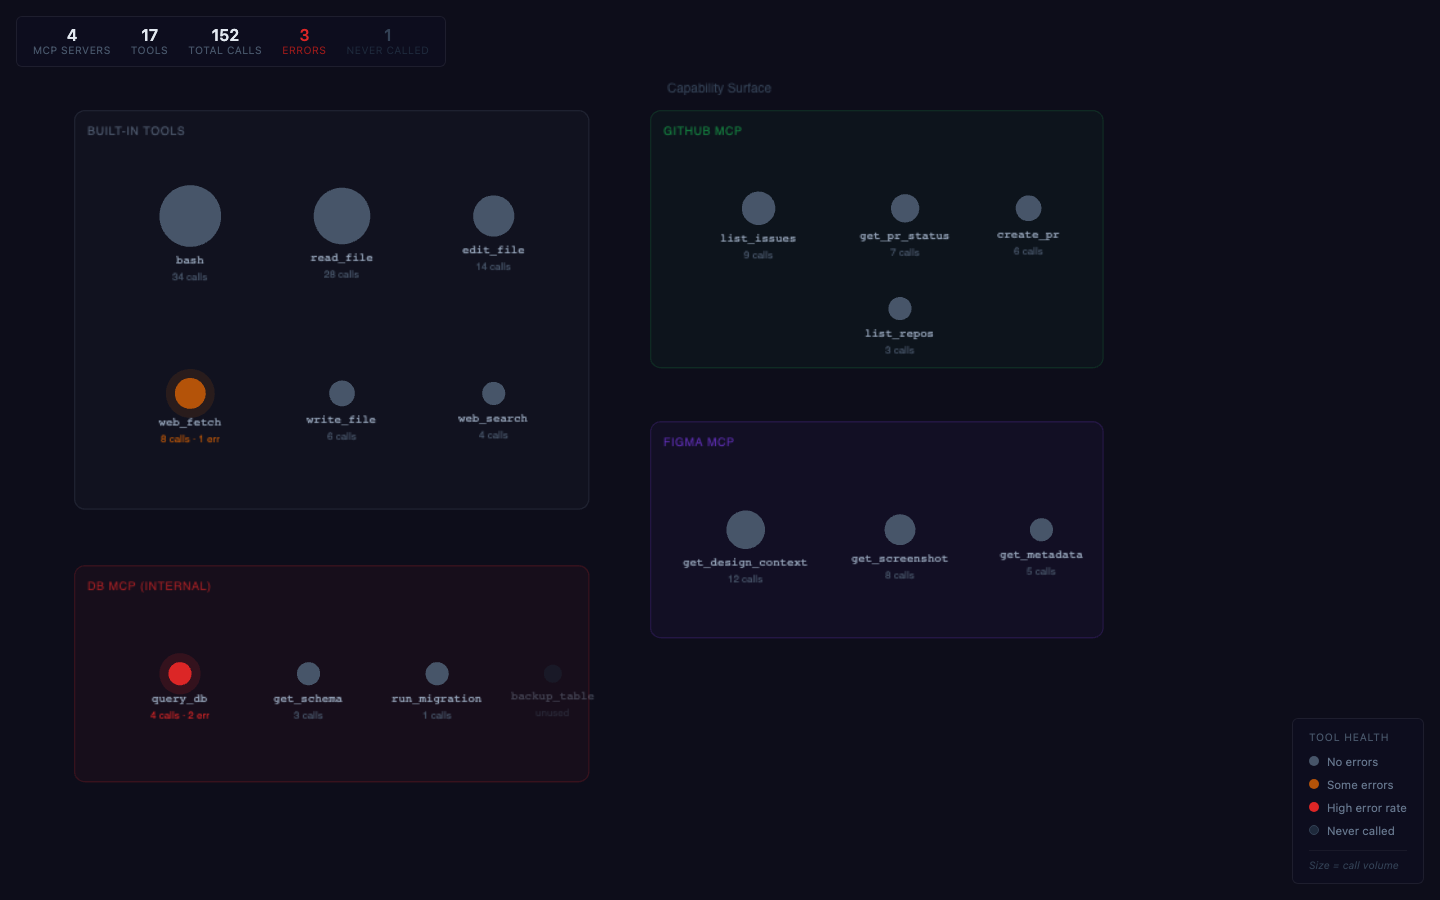
- Capability Surface — "What tools are exposed across the org?"
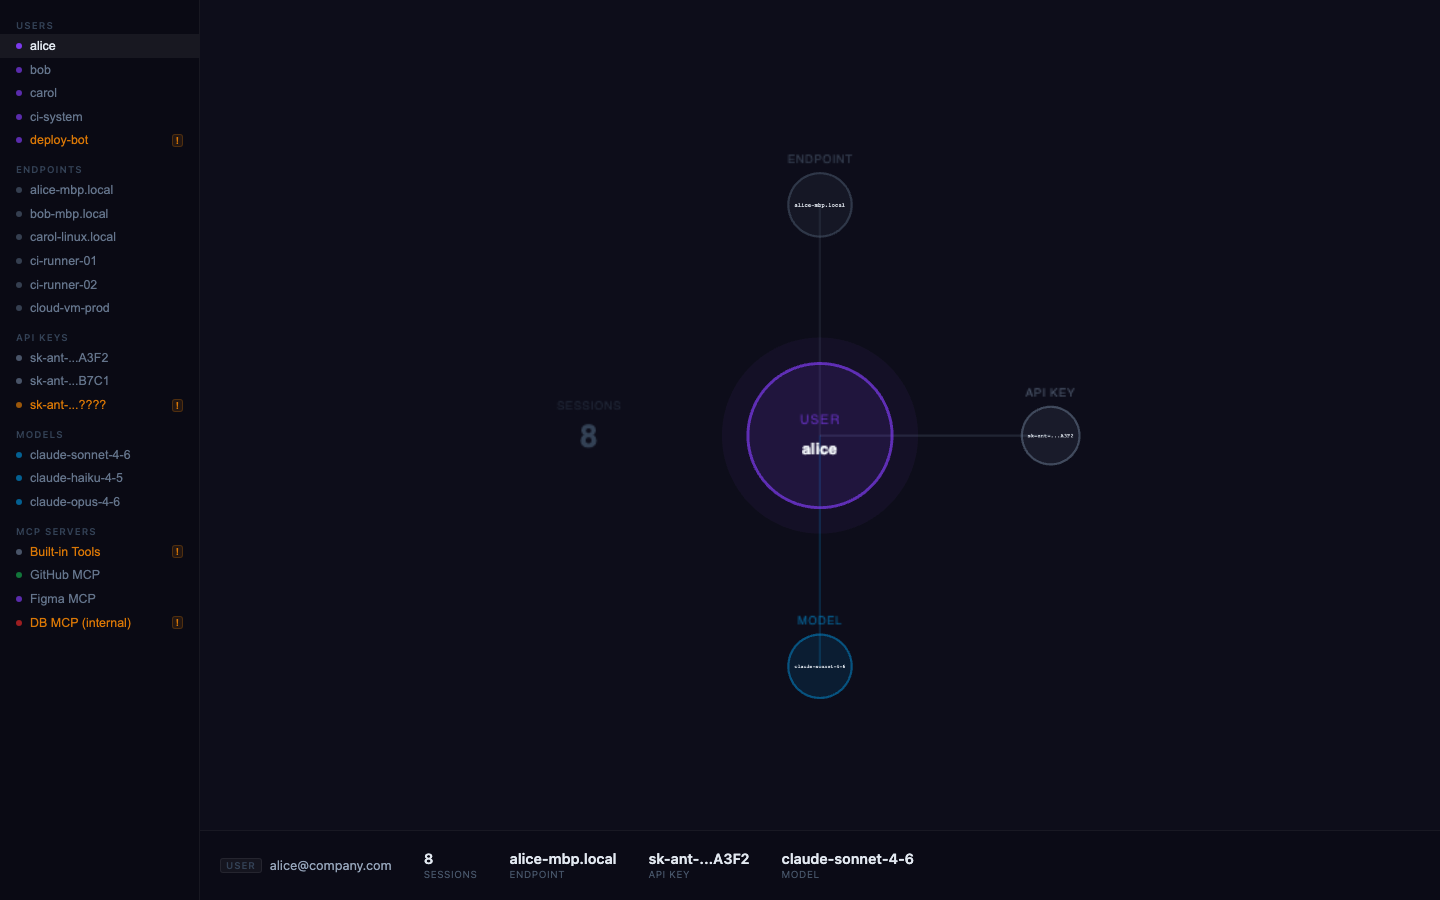
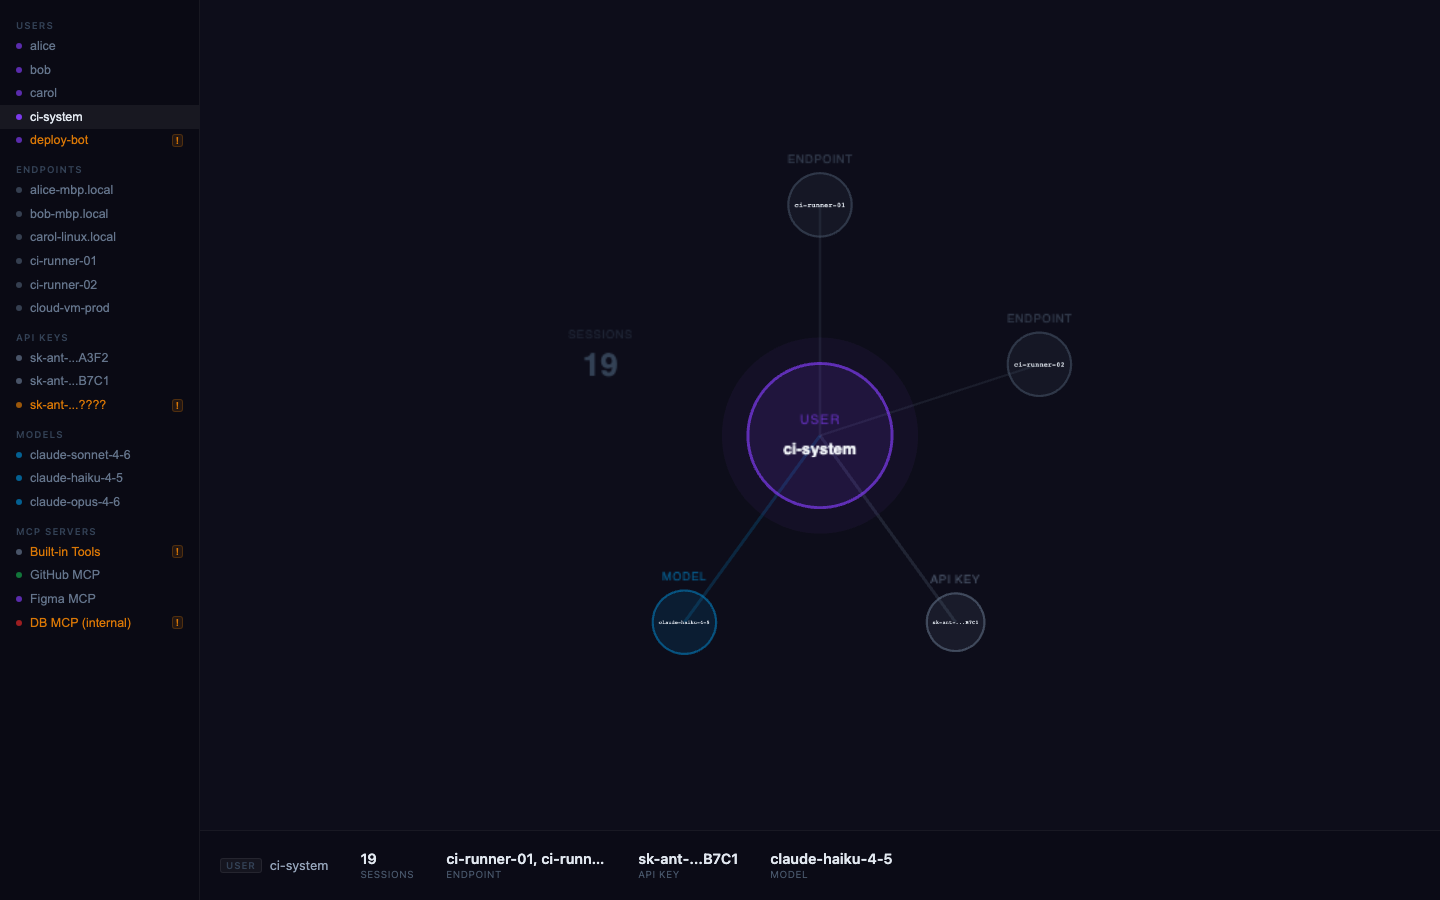
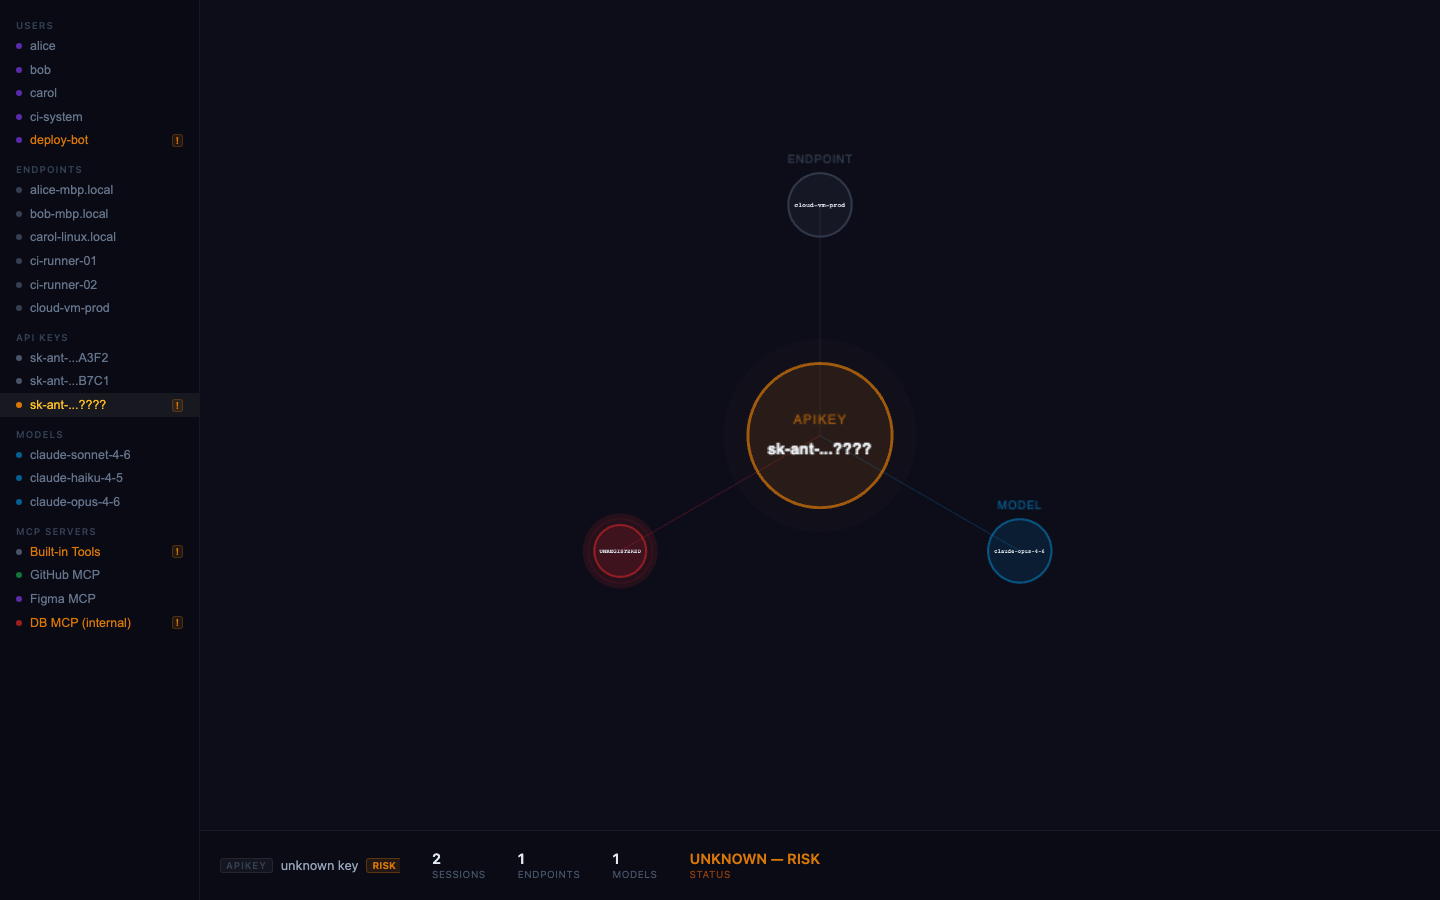
- Inventory View — browse the ecosystem entity-by-entity
Key Changes
The experiment directory was never committed, so there are no git landings; dates below come from file timestamps. All work landed on 2026-04-03.
- 2026-04-03 — Baseline copied from c10.real-data (
main.js,NodeRegistry.js,LiveFeed.js,TrailPulse.js,trail-texture.js);cycle-creation.mdanddata/ai-session.jsadded — a single mock session extracted from bob-wire dashboard-v1 wireframes, extended with an unexpected secondary call (paste.ee) as a risk-signal demo - 2026-04-03 —
ExpSessionGraph.r1.vue— zone layout: linear left-to-right Actors → Infrastructure → Files → External Hosts, directed edges weighted by access count, risk signals (sensitive files red, unexpected hosts orange, pulse rings) - 2026-04-03 —
ExpSessionGraph.r2.vue— radial layout: agent at center, four arc sectors (User, Infrastructure, Files, External Hosts) with donut-slice backgrounds, spoke weight by access count - 2026-04-03 —
ExpInfraMap.r1.vue+data/org-wide.js— org-wide map: endpoints (grouped dev/CI/cloud) connect to models via animated traveling dots, edge color = API key used; concentration risk and credential outliers emerge spatially - 2026-04-03 —
ExpCapSurface.r1.vue+data/capabilities.js— capability surface: four MCP server clusters with tool nodes sized by call volume and colored by error rate; never-called tools dimmed as latent capability - 2026-04-03 —
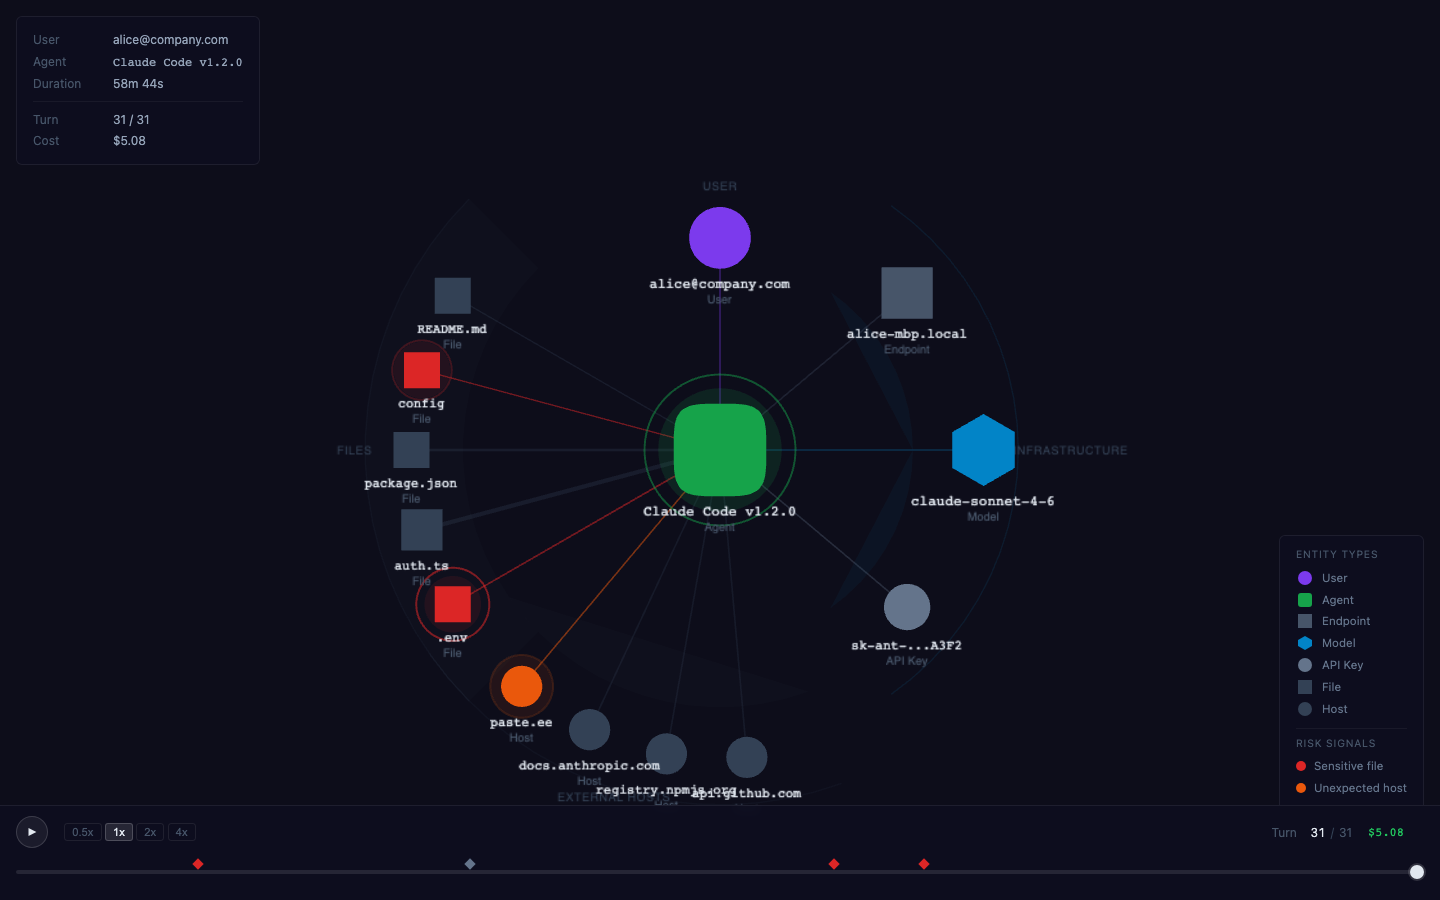
ExpSessionGraph.r3.vue+data/ai-session-timeline.js— playback iteration: session replayed over a timeline with a session-info overlay - 2026-04-03 —
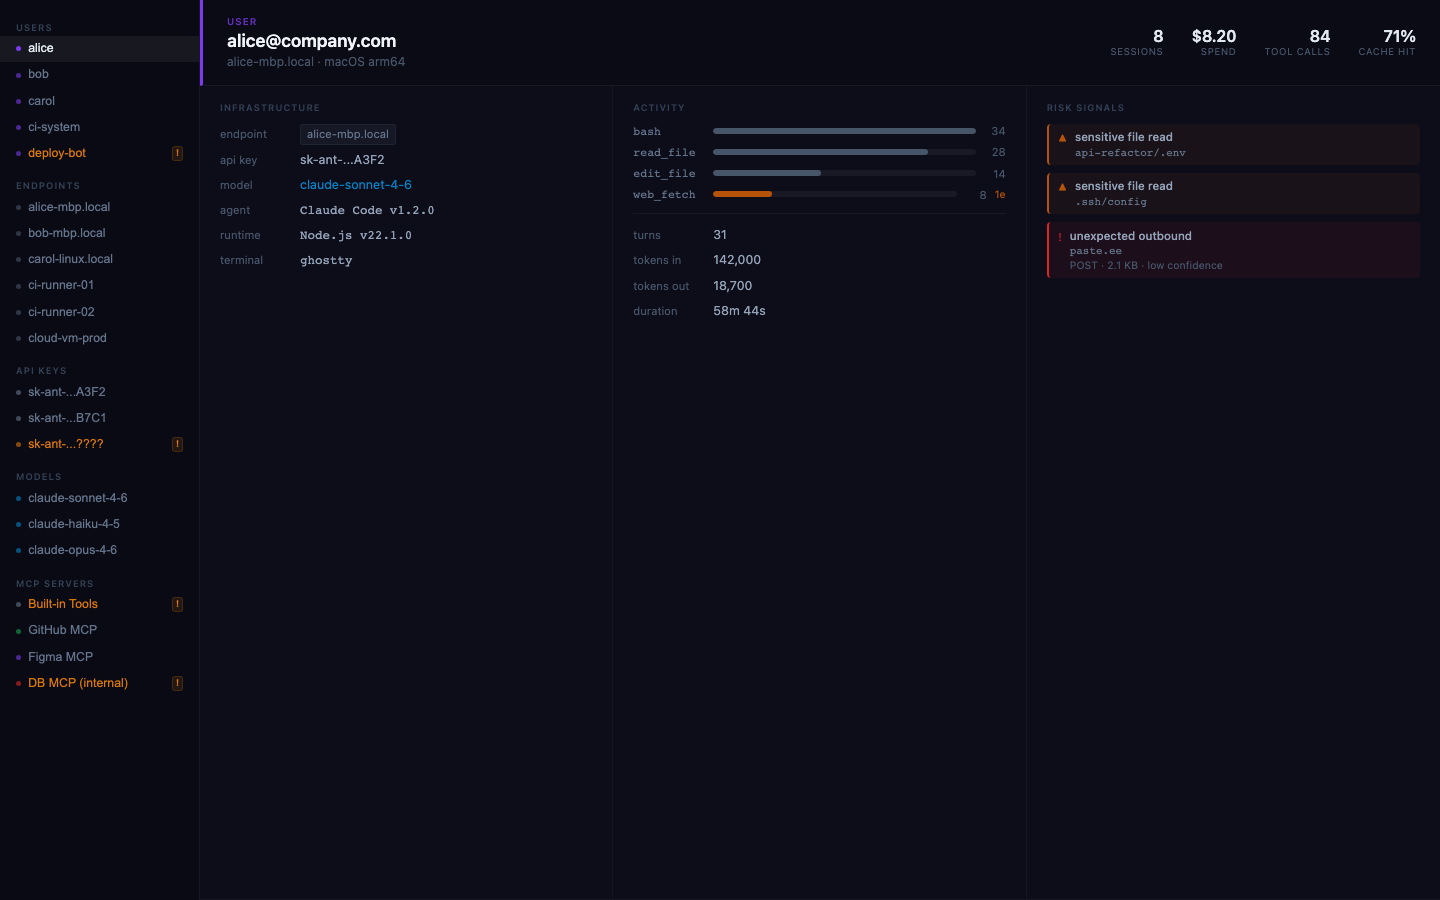
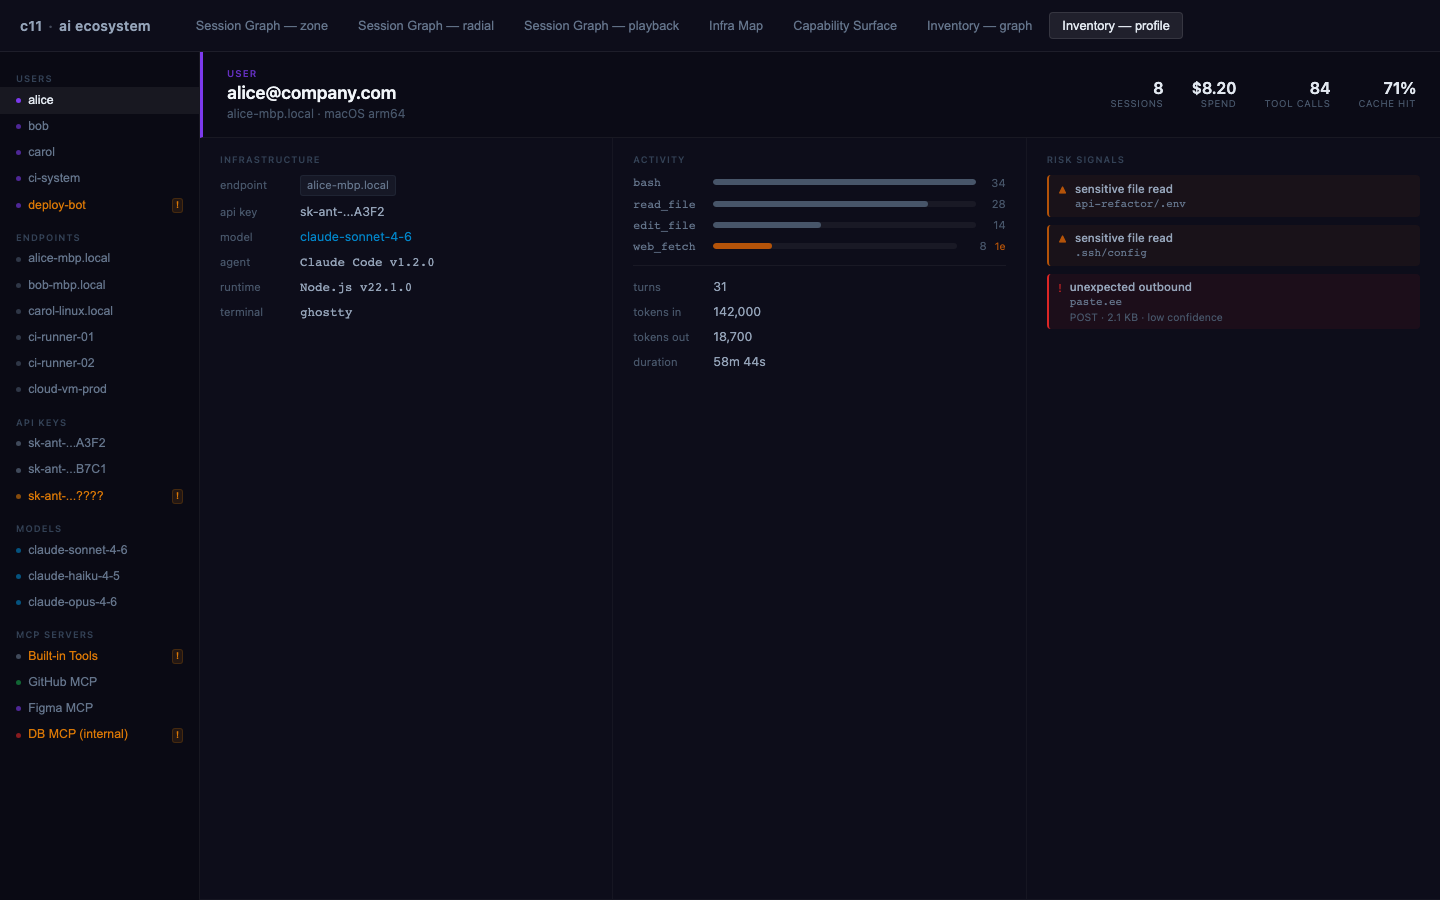
ExpInventoryView.r1.vue/.r2.vue— inventory views: grouped entity sidebar with per-item graph view (r1) and profile view (r2) - 2026-04-03 —
App.vueshell finalized with seven switchable tabs
Outcome
Seven working views in one shell: Session Graph in zone, radial, and playback forms, an org-wide Infra Map, a Capability Surface, and Inventory graph and profile views. The design-side account lives in design c33, which documented qflow's visual output, data model, and limitations in the CLAUDE.md files as part of the same effort. The visual language carried forward: qmap c21 (ai-session-map) was built as the 3D companion to these 2D session graphs, and design c33's record names c41 (signal column flow) and c43 (inventory map) as the follow-ons that continued its threads.
Visual record
11 captures — heroes, page slices, and full-page renders. Click to view.