

← Archive

Now + Trend — Variations

October 1, 2026SeedDashboardProductscreengrab

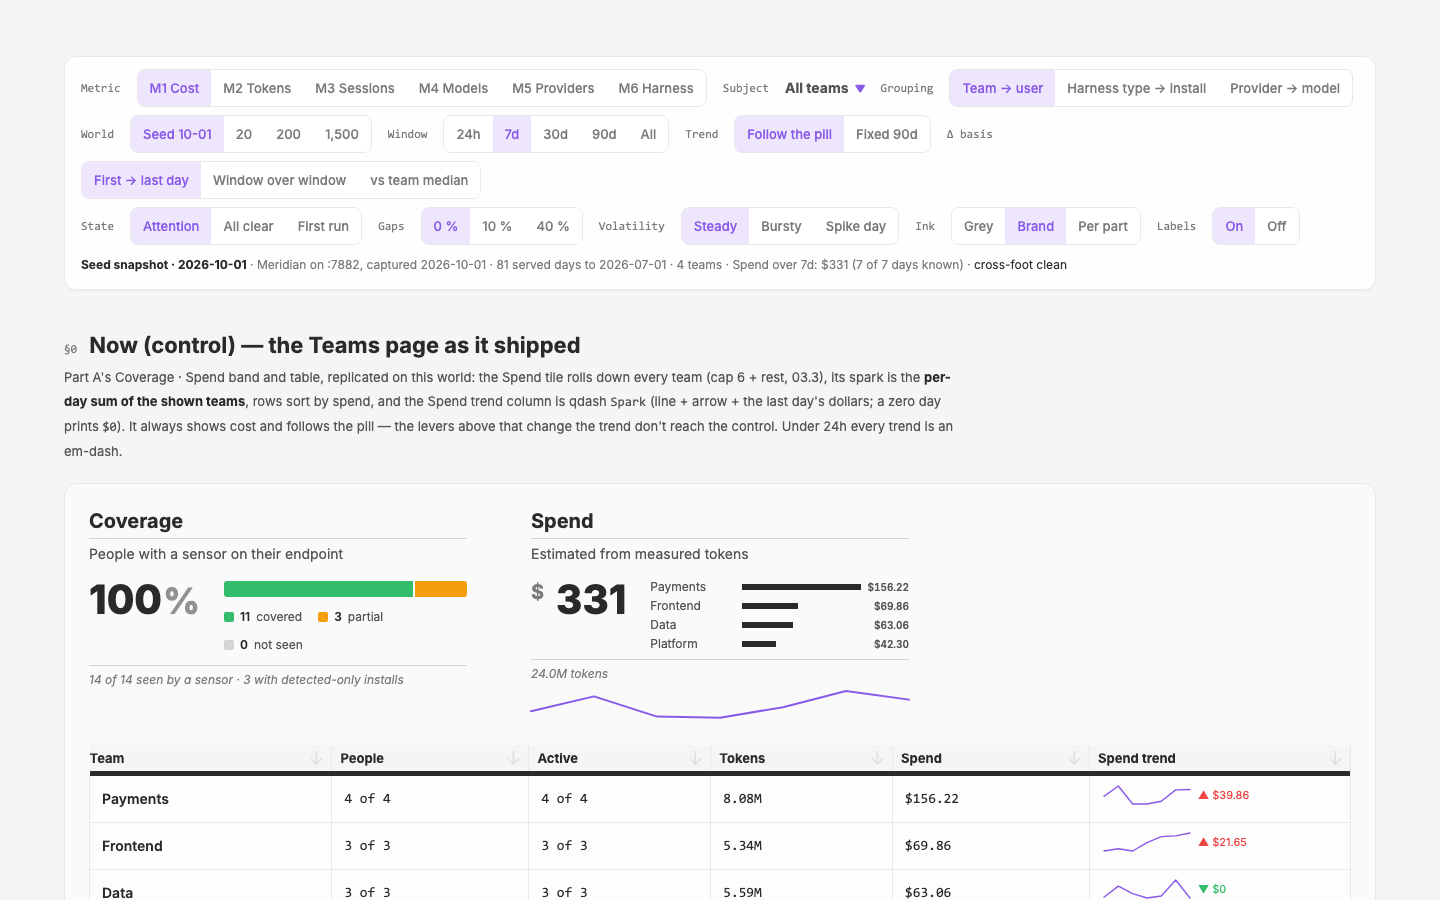
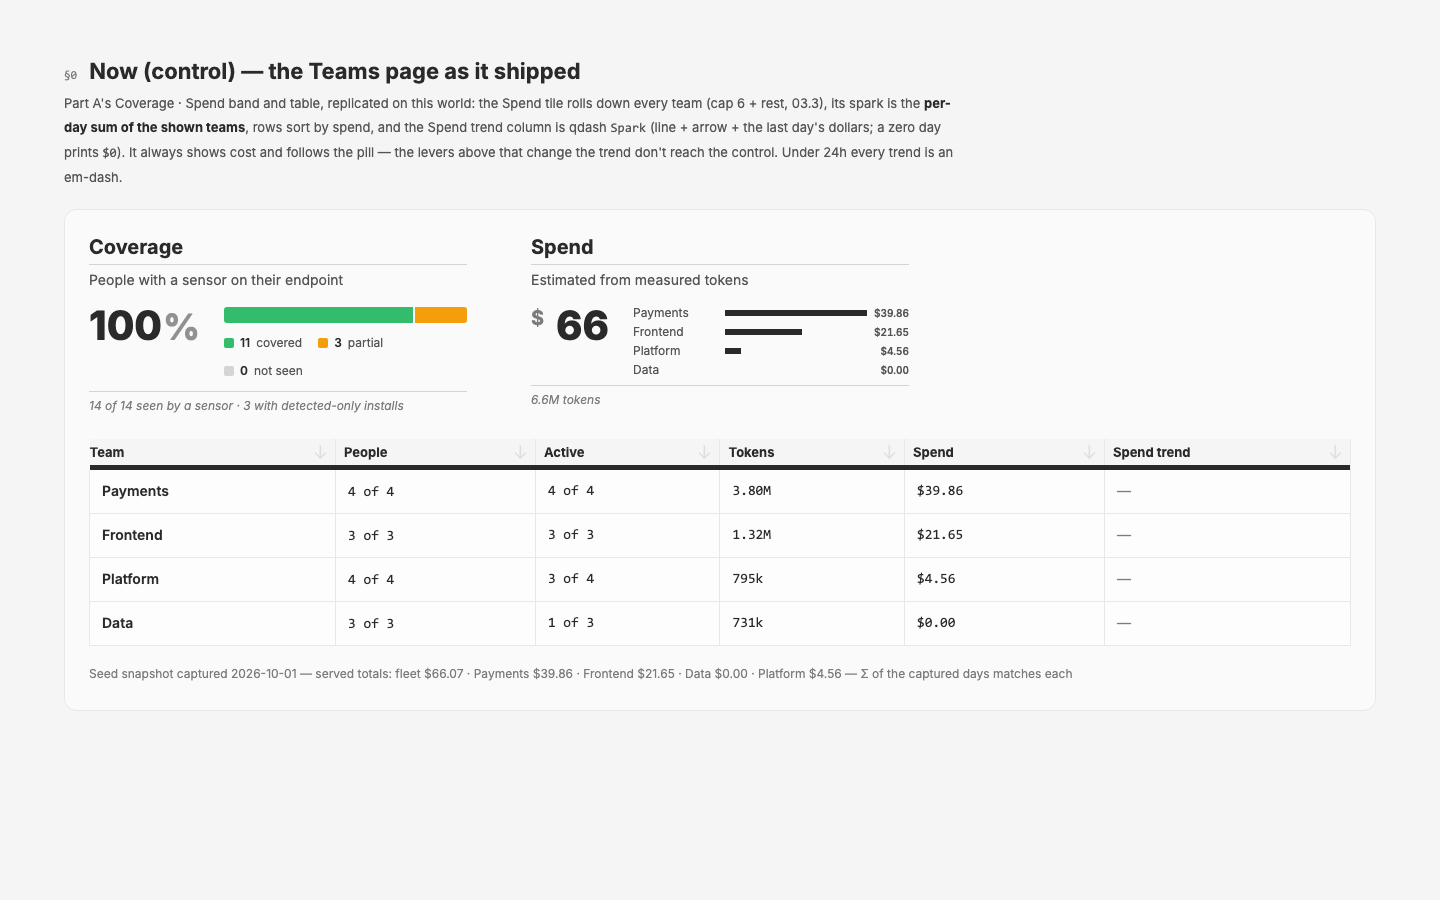
The Now + Trend — Variations page: a sticky lever row (metric, subject, grouping, world, window, trend window, delta basis, state, gaps, volatility, ink, labels) over §0, the Teams page as shipped — Coverage 100 %, Spend $331 rolled down to four teams with a daily spark, and a Spend trend column of sparklines.

§0 Now (control): the Teams page replicated on the seed snapshot — Spend $331 (Payments $156.22 · Frontend $69.86 · Data $63.06 · Platform $42.30), sorted by spend, a Spend trend sparkline per team.
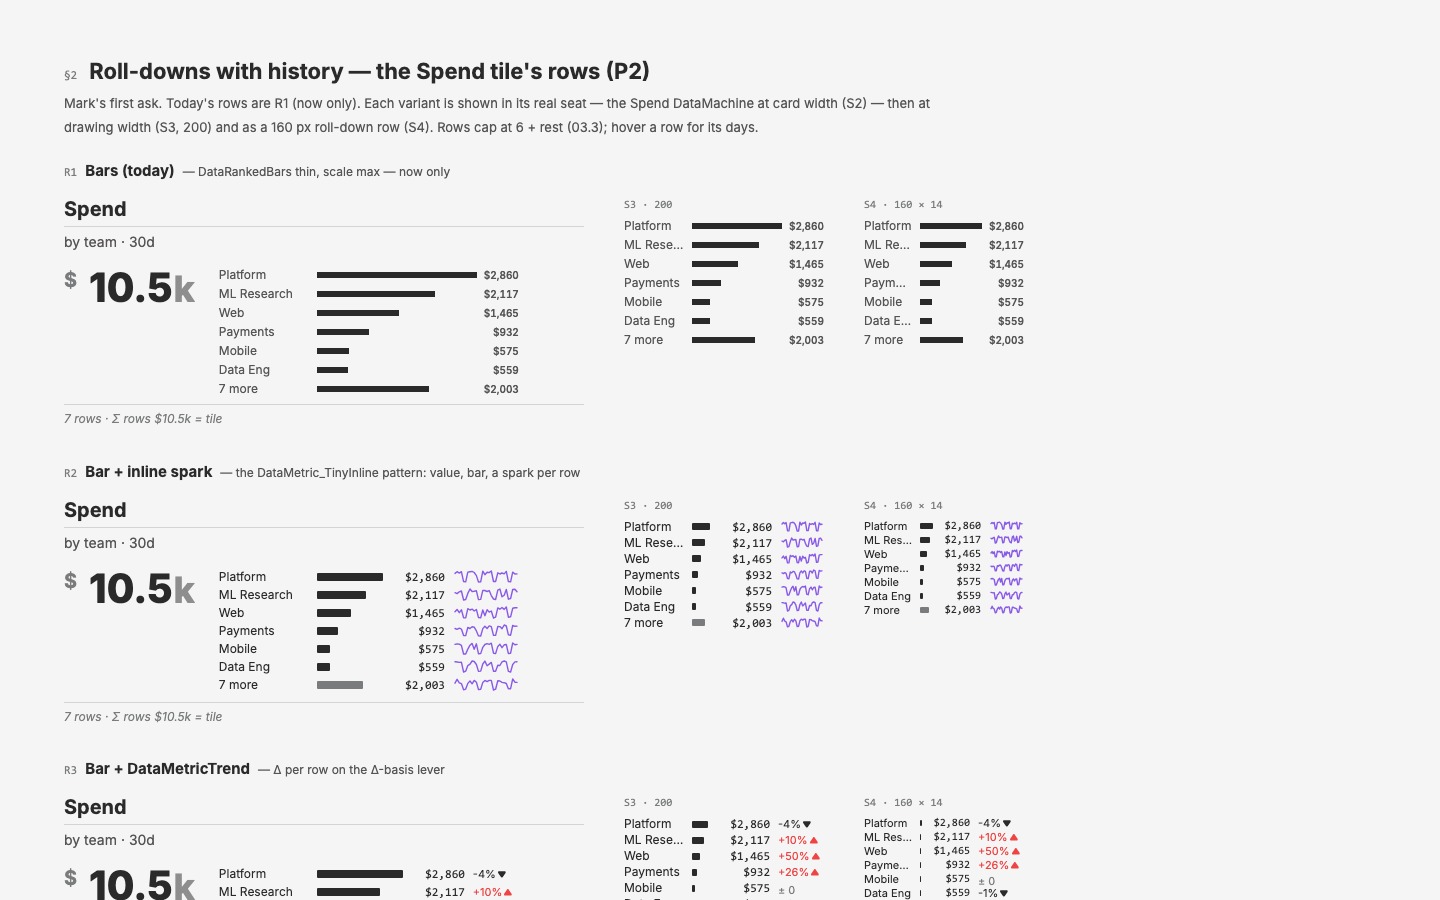
§2 Roll-downs with history: the Spend tile's team rows as bars only (R1), bar plus inline spark (R2) and bar plus DataMetricTrend (R3), each at card width, 200 px and a 160 × 14 row.
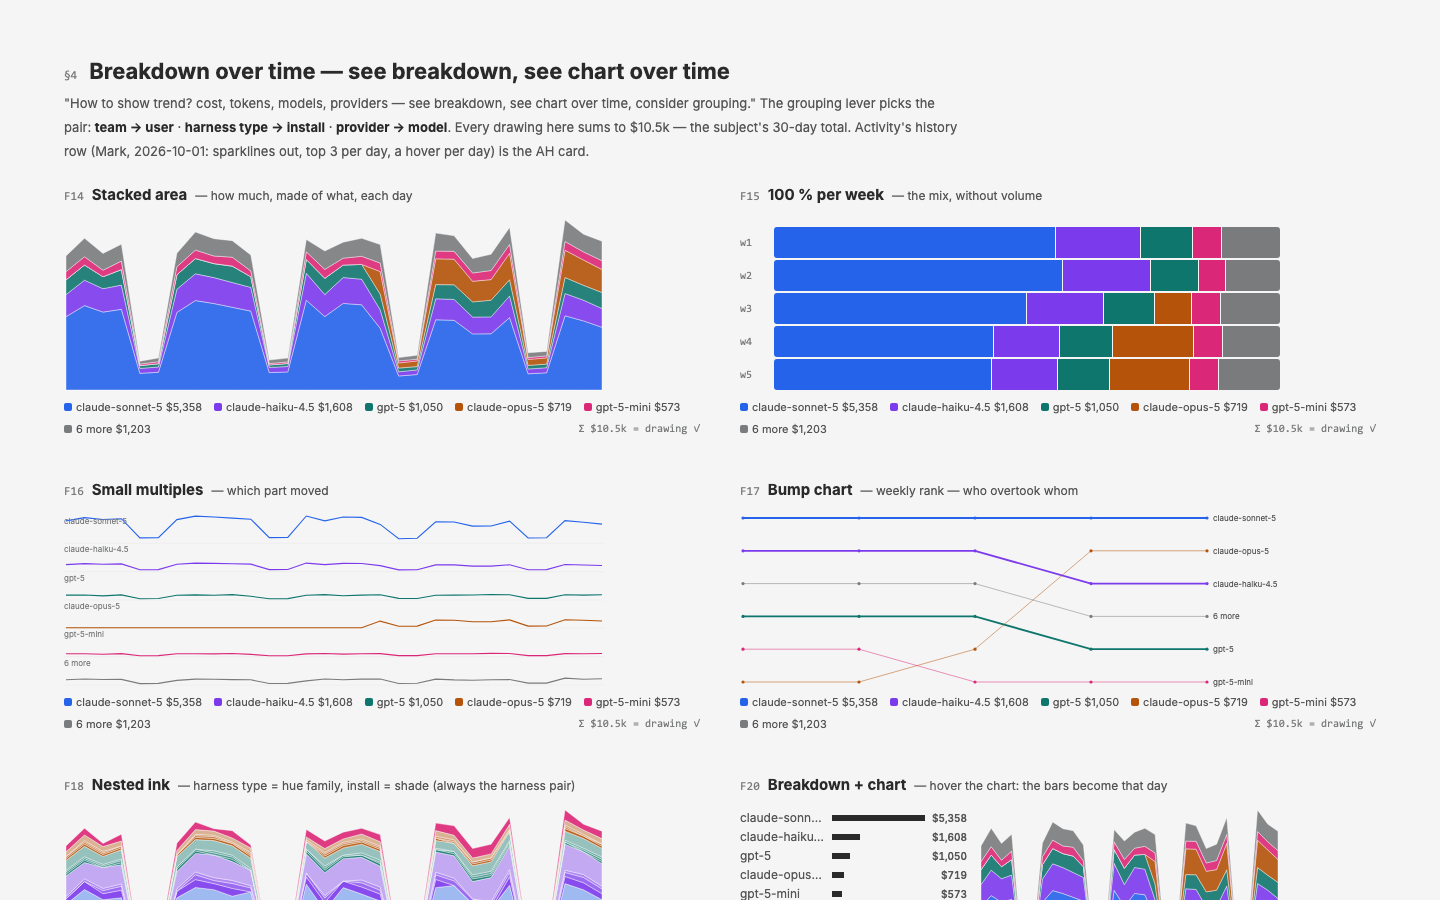
§4 Breakdown over time, grouped provider → model: stacked area, 100 % per week, small multiples and a bump chart of weekly rank — every drawing sums to the $10.5k window total.
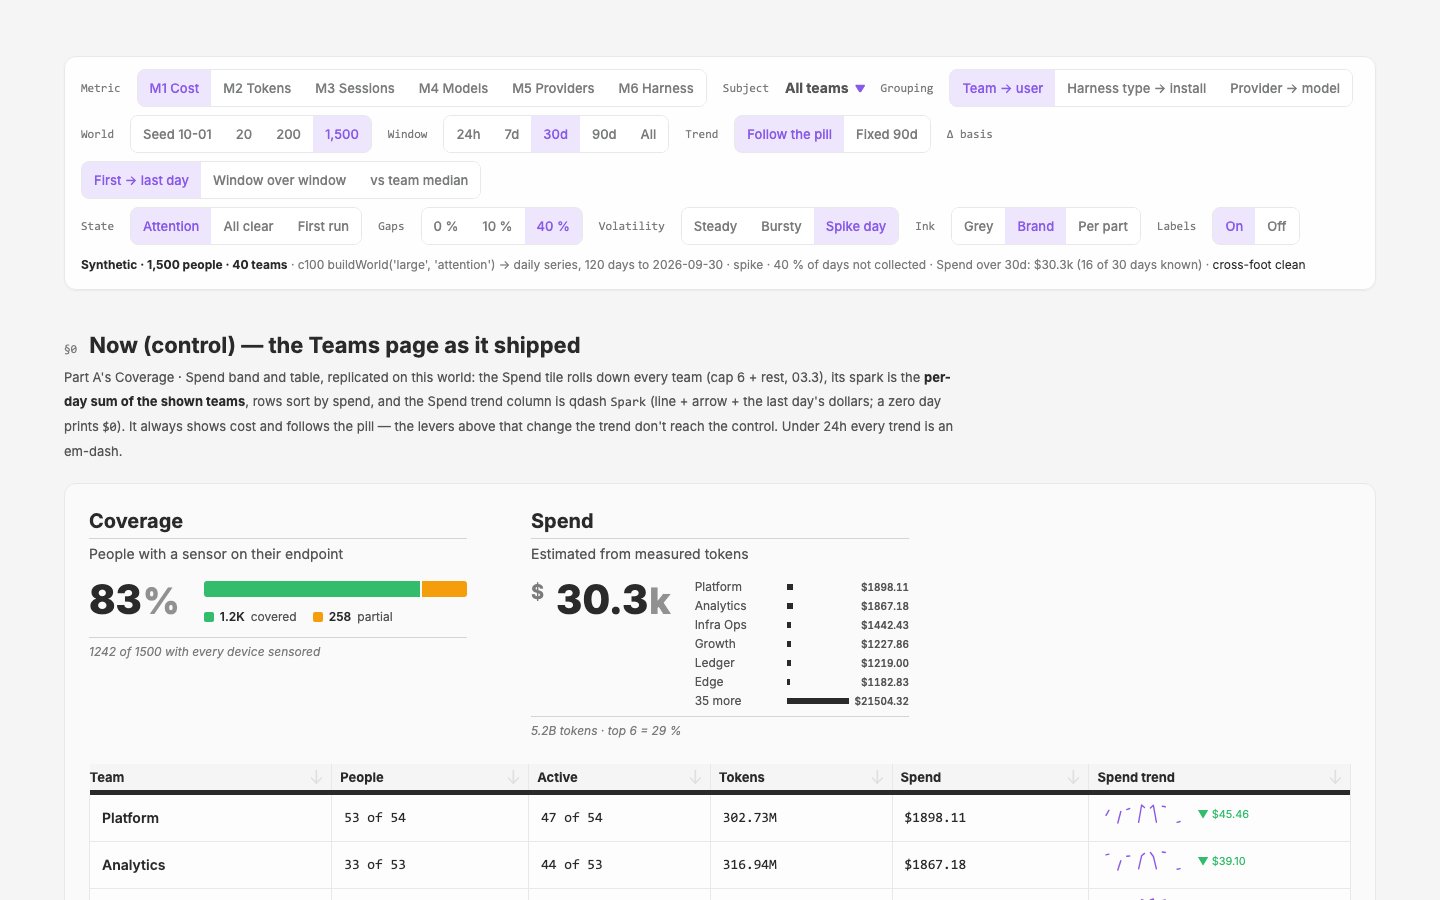
The 1,500-person world at 30d with 40 % of days not collected and a spike day: Spend $30.3k over 40 teams, trend sparklines broken at the missing days rather than drawn through zero.
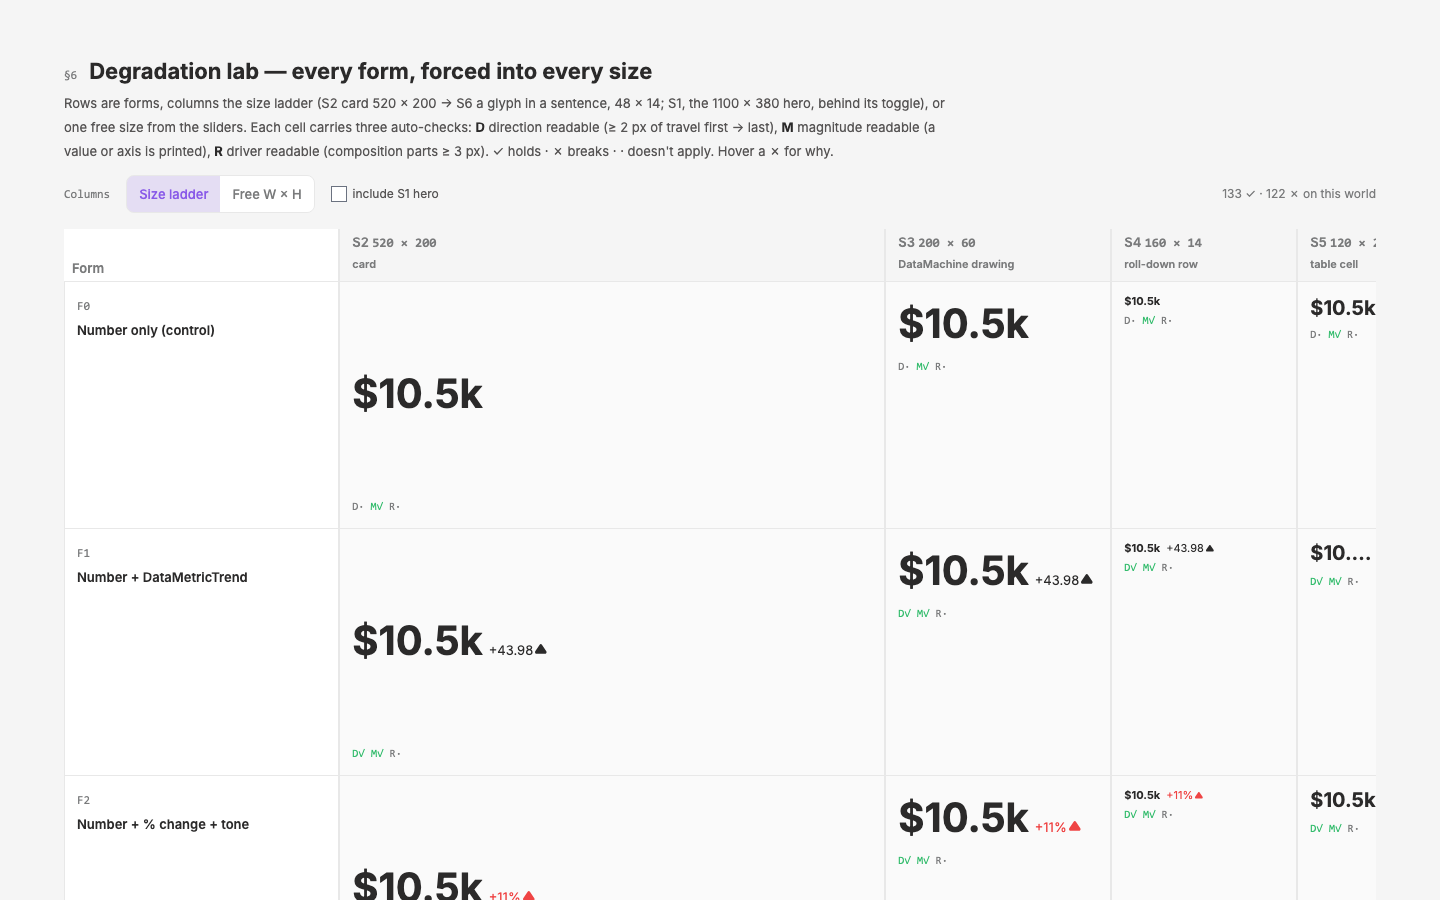
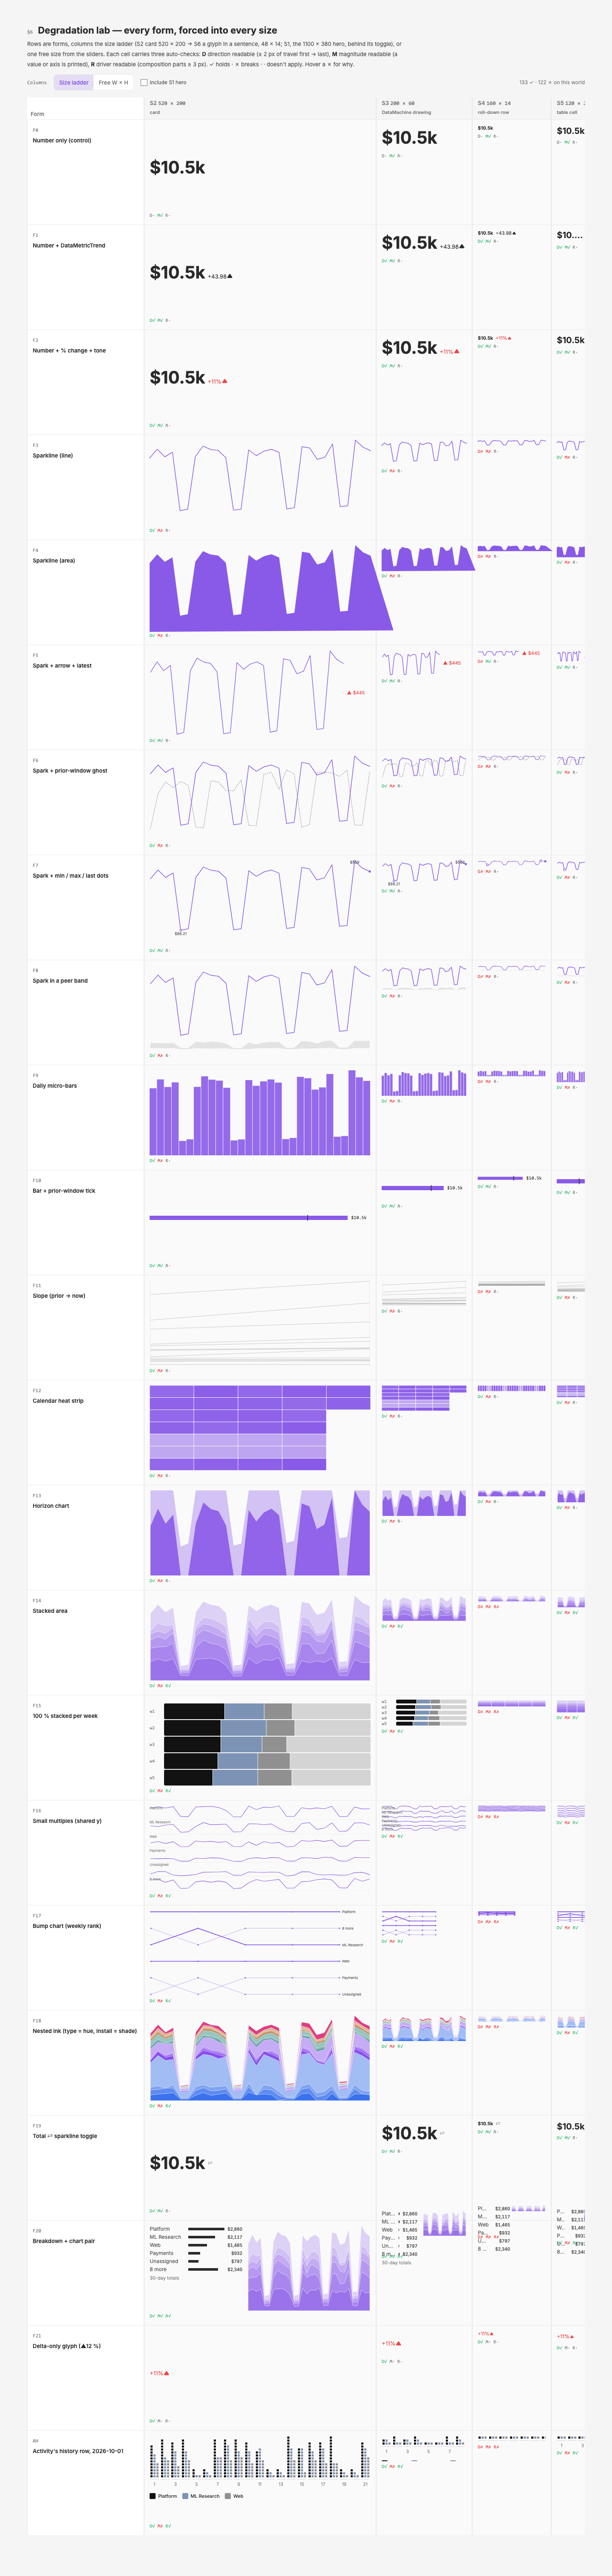
§6 Degradation lab: forms as rows (number only, number + DataMetricTrend, number + % change) forced into the size ladder from a 520 × 200 card down to a 120 px table cell, each cell ticked for direction, magnitude and driver.
§0 at 24h: one known day, so every Spend trend cell is an em-dash and the tile drops its spark — the honest empty state.
The whole page top to bottom: §0 control, §1 the F0–F21 form catalogue plus Activity's history row, §2–§5, the §6 lab and the §7 keep / maybe / kill ledger.
The whole page on the 1,500-person world with 40 % gaps — every form's handling of days that were never collected.
The full degradation lab: every form at every size, with the auto-checks marking where each one breaks.
Project
Dashboard
Designer
Mark
Tool
Playwright capture
Type
screengrab
Tags
c103c100trendteamsqdashphase3exploration

Qpoint Brand Style Guide